Turn on suggestions
Auto-suggest helps you quickly narrow down your search results by suggesting possible matches as you type.
Showing results for
Monitoring Splunk
Turn on suggestions
Auto-suggest helps you quickly narrow down your search results by suggesting possible matches as you type.
Showing results for
- Splunk Answers
- :
- Splunk Administration
- :
- Monitoring Splunk
- :
- In Monitoring console where I can find this dashbo...
Options
- Subscribe to RSS Feed
- Mark Topic as New
- Mark Topic as Read
- Float this Topic for Current User
- Bookmark Topic
- Subscribe to Topic
- Mute Topic
- Printer Friendly Page
- Mark as New
- Bookmark Message
- Subscribe to Message
- Mute Message
- Subscribe to RSS Feed
- Permalink
- Report Inappropriate Content
Praz_123
Path Finder
03-05-2024
10:24 PM
Can , anyone help me where can I find the above dashboard in splunk , in Monitoring console.
1 Solution
- Mark as New
- Bookmark Message
- Subscribe to Message
- Mute Message
- Subscribe to RSS Feed
- Permalink
- Report Inappropriate Content
kiran_panchavat
Contributor
03-05-2024
10:45 PM
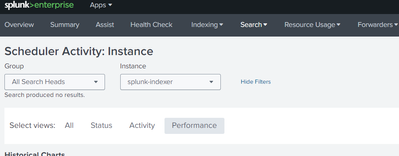
@Praz_123 I can see "Execution Latency Over Time" panel in the "Search > Scheduler Activity:Instance" > Performance in the Splunk Version:9.2.0.1
- Mark as New
- Bookmark Message
- Subscribe to Message
- Mute Message
- Subscribe to RSS Feed
- Permalink
- Report Inappropriate Content
Praz_123
Path Finder
03-05-2024
11:50 PM
@kiran_panchavat , thanks for your help
- Mark as New
- Bookmark Message
- Subscribe to Message
- Mute Message
- Subscribe to RSS Feed
- Permalink
- Report Inappropriate Content
kiran_panchavat
Contributor
03-05-2024
10:45 PM
@Praz_123 I can see "Execution Latency Over Time" panel in the "Search > Scheduler Activity:Instance" > Performance in the Splunk Version:9.2.0.1
Get Updates on the Splunk Community!
Modern way of developing distributed application using OTel
Recently, I had the opportunity to work on a complex microservice using Spring boot and Quarkus to develop a ...
Enterprise Security Content Update (ESCU) | New Releases
Last month, the Splunk Threat Research Team had 3 releases of new security content via the Enterprise Security ...
Archived Metrics Now Available for APAC and EMEA realms
We’re excited to announce the launch of Archived Metrics in Splunk Infrastructure Monitoring for our customers ...


