Turn on suggestions
Auto-suggest helps you quickly narrow down your search results by suggesting possible matches as you type.
Showing results for
Monitoring Splunk
Turn on suggestions
Auto-suggest helps you quickly narrow down your search results by suggesting possible matches as you type.
Showing results for
- Splunk Answers
- :
- Splunk Administration
- :
- Monitoring Splunk
- :
- In Monitoring console where I can find this dashbo...
Options
- Subscribe to RSS Feed
- Mark Topic as New
- Mark Topic as Read
- Float this Topic for Current User
- Bookmark Topic
- Subscribe to Topic
- Mute Topic
- Printer Friendly Page
- Mark as New
- Bookmark Message
- Subscribe to Message
- Mute Message
- Subscribe to RSS Feed
- Permalink
- Report Inappropriate Content
Praz_123
Path Finder
03-05-2024
10:24 PM
Can , anyone help me where can I find the above dashboard in splunk , in Monitoring console.
1 Solution
- Mark as New
- Bookmark Message
- Subscribe to Message
- Mute Message
- Subscribe to RSS Feed
- Permalink
- Report Inappropriate Content
kiran_panchavat
Communicator
03-05-2024
10:45 PM
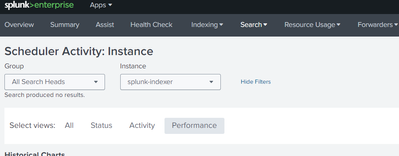
@Praz_123 I can see "Execution Latency Over Time" panel in the "Search > Scheduler Activity:Instance" > Performance in the Splunk Version:9.2.0.1
- Mark as New
- Bookmark Message
- Subscribe to Message
- Mute Message
- Subscribe to RSS Feed
- Permalink
- Report Inappropriate Content
Praz_123
Path Finder
03-05-2024
11:50 PM
@kiran_panchavat , thanks for your help
- Mark as New
- Bookmark Message
- Subscribe to Message
- Mute Message
- Subscribe to RSS Feed
- Permalink
- Report Inappropriate Content
kiran_panchavat
Communicator
03-05-2024
10:45 PM
@Praz_123 I can see "Execution Latency Over Time" panel in the "Search > Scheduler Activity:Instance" > Performance in the Splunk Version:9.2.0.1
Get Updates on the Splunk Community!
Threat Hunting Unlocked: How to Uplevel Your Threat Hunting With the PEAK Framework ...
WATCH NOWAs AI starts tackling low level alerts, it's more critical than ever to uplevel your threat hunting ...
Splunk APM: New Product Features + Community Office Hours Recap!
Howdy Splunk Community! Over the past few months, we’ve had a lot going on in the world of Splunk Application ...
Index This | Forward, I’m heavy; backward, I’m not. What am I?
April 2024 Edition
Hayyy Splunk Education Enthusiasts and the Eternally Curious!
We’re back with another ...


