- Find Answers
- :
- Splunk Administration
- :
- Admin Other
- :
- Knowledge Management
- :
- Splunk Thinking - I need max(X) when you see Y hap...
- Subscribe to RSS Feed
- Mark Topic as New
- Mark Topic as Read
- Float this Topic for Current User
- Bookmark Topic
- Subscribe to Topic
- Mute Topic
- Printer Friendly Page
- Mark as New
- Bookmark Message
- Subscribe to Message
- Mute Message
- Subscribe to RSS Feed
- Permalink
- Report Inappropriate Content
So I’m struggling with something basic here. I just don’t quite understand how Splunk wants to look at the data, once I understand that everything else should fall into place.
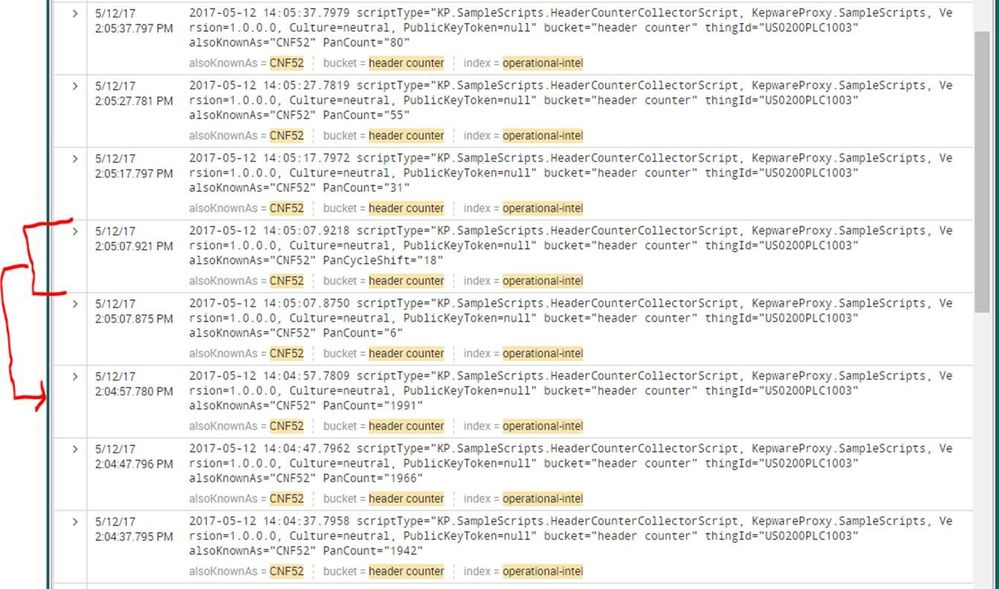
In this example, the PanCycleShift=18 event is a step performed by the operator when he opens a big gate and parts fall out.
I am interested in the PanCount value right at/right before PanCycleShift increments, or how many parts were in the pan before he opened the gate.
But, since Kepware IoT Gateway is reporting data changes every 10 seconds (for now), in the below example you can see that a PanCount event traveled with the PanCycleShift event.
I do not want PanCount=6, I want PanCount=1991 as the number of parts that fell out of the gate when PanCycleShift=18 occurred.
How does Splunk want me to think around this problem?
Thanks
Chris
- Mark as New
- Bookmark Message
- Subscribe to Message
- Mute Message
- Subscribe to RSS Feed
- Permalink
- Report Inappropriate Content
Right; the filldown extends the PanCycleShift to the other events and then you check all of those events for the biggest PanCount value. So did this solve your problem? If so, then do click Accept to close it.
- Mark as New
- Bookmark Message
- Subscribe to Message
- Mute Message
- Subscribe to RSS Feed
- Permalink
- Report Inappropriate Content
Try this:
YOUR BASE SEARCH HERE
| filldown PanCycleShift
| stats max(PanCount) BY PanCycleShift
- Mark as New
- Bookmark Message
- Subscribe to Message
- Mute Message
- Subscribe to RSS Feed
- Permalink
- Report Inappropriate Content
Why does this work? Why does it display 1991 and not 6 if it is getting the last non null?

BASE_SEARCH (PanCount=* OR PanCycleShift=*) | sort - _time | filldown PanCycleShift | stats max(PanCount) BY PanCycleShift
- Mark as New
- Bookmark Message
- Subscribe to Message
- Mute Message
- Subscribe to RSS Feed
- Permalink
- Report Inappropriate Content
You need sort 0 - _time or you will be dropping events.
- Mark as New
- Bookmark Message
- Subscribe to Message
- Mute Message
- Subscribe to RSS Feed
- Permalink
- Report Inappropriate Content
Ohhhhh, I get it, because I'm getting the max(PanCount)
- Mark as New
- Bookmark Message
- Subscribe to Message
- Mute Message
- Subscribe to RSS Feed
- Permalink
- Report Inappropriate Content
Right; the filldown extends the PanCycleShift to the other events and then you check all of those events for the biggest PanCount value. So did this solve your problem? If so, then do click Accept to close it.
- Mark as New
- Bookmark Message
- Subscribe to Message
- Mute Message
- Subscribe to RSS Feed
- Permalink
- Report Inappropriate Content
What's the logic behind only selecting ene with PanCount=1991 but not PanCount=6? Based on timestmap (select the previous 10s window?
- Mark as New
- Bookmark Message
- Subscribe to Message
- Mute Message
- Subscribe to RSS Feed
- Permalink
- Report Inappropriate Content
I need to know how many pieces were in the pan when the pan cycled. Which would be the bigger number surrounding the pan cycle event. What most likely happened in this case is that somewhere between 2:04:57 and 2:05:07,
- the machine stopped producing pieces and the pan count remained at 1991
- OR because of my 10 second data collection interval I never captured the true maximum value and never captured the pan count rolling over to zero

