- Find Answers
- :
- Splunk Administration
- :
- Admin Other
- :
- Knowledge Management
- :
- Mis-behaving field extractions: Why are deleted ex...
- Subscribe to RSS Feed
- Mark Topic as New
- Mark Topic as Read
- Float this Topic for Current User
- Bookmark Topic
- Subscribe to Topic
- Mute Topic
- Printer Friendly Page
- Mark as New
- Bookmark Message
- Subscribe to Message
- Mute Message
- Subscribe to RSS Feed
- Permalink
- Report Inappropriate Content
Mis-behaving field extractions: Why are deleted extractions still being referenced?
I have a field extraction I've created that replaces a couple of previous extractions I deleted. However I have a couple of reports that still reference the deleted extractions when I view the available fields in the events.
I've tried re-creating the report and still get the same behavior. I will also mention if I change the evtid in the query below to another possible value, I get available fields I expect to see. Any ideas what might be going on? The extracted field is vmax_message. vmax_host is also an extracted field and works just fine.
index=vmax_syslog sourcetype=vmax:syslog fmt=evt vmax_host=*san* evtid=5200 sev="warning"
| eval Time = strftime(_time, "%Y-%m-%d %H:%M:%S")
| chart values(symid) AS symid values(vmax_message)  AS message values(sev) AS severity values(Time) as Time by vmax_host
- Mark as New
- Bookmark Message
- Subscribe to Message
- Mute Message
- Subscribe to RSS Feed
- Permalink
- Report Inappropriate Content
Thanks for all the suggestions. I've looked in Settings searching with all the variations listed and the fact remains that my deleted extractions don't show up in any searches, yet for some reason the report's event list still references them as extracted fields.
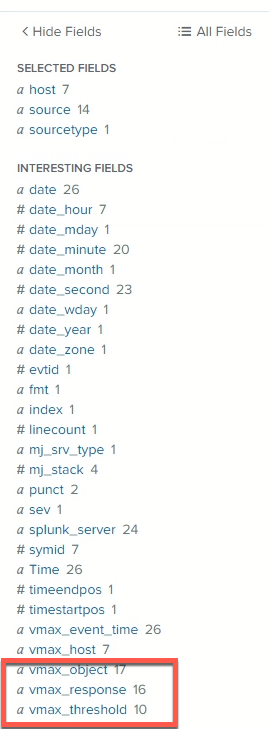
the query is using vmax_message as my extracted field (which does show up in Settings->Field extractions). Here's a screenshot of the fields from the events returned by that query. The extracted fields inside the red box are fields I deleted and don't show up in Settings->Field extractions even with the broadest filter from the dropdowns. So I have no idea why those are "stuck". And as I've mentioned I've tried recreating the report from scratch but the result is the same.
The other strange thing about this is if I change the evtid to a value other than 5200, the new extraction appears and the deleted ones don't. So I'm wondering if it has something to do with the fact that I created the extraction specifically with the above query?
- Mark as New
- Bookmark Message
- Subscribe to Message
- Mute Message
- Subscribe to RSS Feed
- Permalink
- Report Inappropriate Content
- Mark as New
- Bookmark Message
- Subscribe to Message
- Mute Message
- Subscribe to RSS Feed
- Permalink
- Report Inappropriate Content
But those are fields that should have been deleted again from the Settings->Fields menu.
- Mark as New
- Bookmark Message
- Subscribe to Message
- Mute Message
- Subscribe to RSS Feed
- Permalink
- Report Inappropriate Content
Are those search-time extractions or indexed fields? How did you "delete" those extractions?
- Mark as New
- Bookmark Message
- Subscribe to Message
- Mute Message
- Subscribe to RSS Feed
- Permalink
- Report Inappropriate Content
I don't honestly know the answer to indexed vs. search time. I created it through the event "extract field". When I view it through Settings->Fields it says Inline which is also the interface I used to delete the ones I no longer needed.
I'm an end user and don't have any administrative permissions to see .conf files and such.
- Mark as New
- Bookmark Message
- Subscribe to Message
- Mute Message
- Subscribe to RSS Feed
- Permalink
- Report Inappropriate Content
Ok. So you most probably touched search-time extractions.
Indexed fields are extracted only once at the - as the name says - index time and stored with the event forever. Search-time extractions are performed every time you search in splunk.
Use the settings->fields->field extractions and browse through the fields visible in the app you are searching in (most probably the default search app).
Unfortunately, it's not that easy to say where whis particular extraction is defined since it can be defined in any app that you have access to and can be defined as either inline extraction, transform-based extraction or can be a calculated field. It's way easier to define a new extraction than to find existing one sometimes.
Also for some types of data fields can be extracted automatically (json, xml, csv, some key-value formats). And even if not, the extraction can be non-explicit (with dynamically extracted field name). So it might not be that obvious I'm afraid.
- Mark as New
- Bookmark Message
- Subscribe to Message
- Mute Message
- Subscribe to RSS Feed
- Permalink
- Report Inappropriate Content
As you are an end user those are definitely search time definitions (unless you have single node installation and you have ported some data, but I suppose that this is not an option in this case).
You should select App = All on that Field extractions screen to see all. You could also try to filter those by selecting Owner = <your name/account from list>.
If this don't show that then another place is Settings -> All Configurations. Also there select above filters into use.
r. Ismo

