Join the Conversation
- Find Answers
- :
- Splunk Administration
- :
- Admin Other
- :
- Installation
- :
- Fortigate App for Splunk: How to setup and populat...
- Subscribe to RSS Feed
- Mark Topic as New
- Mark Topic as Read
- Float this Topic for Current User
- Bookmark Topic
- Subscribe to Topic
- Mute Topic
- Printer Friendly Page
- Mark as New
- Bookmark Message
- Subscribe to Message
- Mute Message
- Subscribe to RSS Feed
- Permalink
- Report Inappropriate Content
Fortigate App for Splunk: How to setup and populate the logs?
Hi,
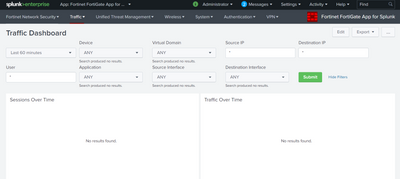
I am trying to configure the Fortigate App for splunk, the first dashboard is working fine but no traffic, event dashboard showing empty
if any one know how to setup and populate the logs pls help me.
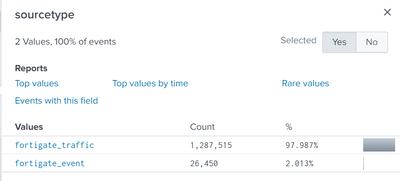
Above is image current source type and index name is firewall
But Below Dashboard is empty
- Mark as New
- Bookmark Message
- Subscribe to Message
- Mute Message
- Subscribe to RSS Feed
- Permalink
- Report Inappropriate Content
Hi,
Some of Dashboards in apps use Data Model for searching. so you should accelerate the data model.
you can set Acceleration from Web GUI in "Settings>Data Models" then find data model "Fortinet FOS Log" click on "Edit" and press "Edit Acceleration" then check Accelerate and set Summary Range and Save.
Data Model Acceleration time depends on your objects and Summary range so you have too wait for a while then go back check your dashboards.
More info about Accelerate Data Models :
https://docs.splunk.com/Documentation/SplunkCloud/latest/Knowledge/Acceleratedatamodels
How to Accelerate Data Model:
https://docs.splunk.com/Documentation/CIM/5.0.1/User/AccelerateCIMdatamodels
Good Luck


