Are you a member of the Splunk Community?
- Find Answers
- :
- Splunk Administration
- :
- Getting Data In
- :
- Why does Splunk seem to have more than 90 days of ...
- Subscribe to RSS Feed
- Mark Topic as New
- Mark Topic as Read
- Float this Topic for Current User
- Bookmark Topic
- Subscribe to Topic
- Mute Topic
- Printer Friendly Page
- Mark as New
- Bookmark Message
- Subscribe to Message
- Mute Message
- Subscribe to RSS Feed
- Permalink
- Report Inappropriate Content
Why does Splunk seem to have more than 90 days of data with our frozenTimePeriodInSecs setting?
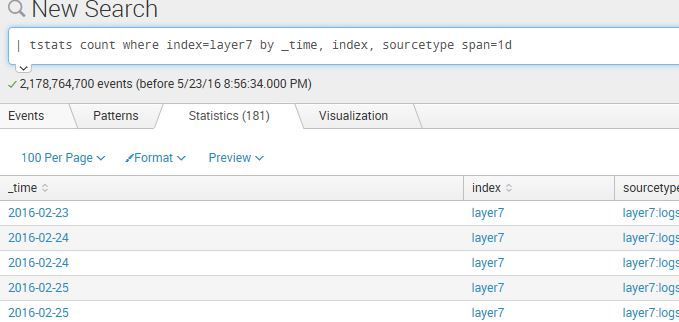
We changed frozenTimePeriodInSecs = 10368000 (120 days from 90 days) for the layer7 index 30 days ago.
It shows the following:
However, when it reached the the three months break of 2/23, it showed 1,401,173,823 of 1,401,173,823 events matched, but no events kept showing up. We ended up with 2.1 billion events processed. So, it seems as though Splunk has more than 90 days of data, but it stops showing events at the 90 days break.
On the indexer, under the cold bucket, the oldest directory is of 2/23.
What can it be?
- Mark as New
- Bookmark Message
- Subscribe to Message
- Mute Message
- Subscribe to RSS Feed
- Permalink
- Report Inappropriate Content
Thank you for the help - we "simply" ran out of space for this specific index of 500 GBs. it coincided with the 90 days period which threw us off.
- Mark as New
- Bookmark Message
- Subscribe to Message
- Mute Message
- Subscribe to RSS Feed
- Permalink
- Report Inappropriate Content
You didn't show the time period you picked for your search. If it was last 90 days then it would only show events for that range.
As far as the frozenTimePeriodInSecs setting, a bucket will only be frozen if the youngest event in the bucket exceeds that time period. So there could be buckets with most of their events past 90 days but not all so it will still be in the cold db.
- Mark as New
- Bookmark Message
- Subscribe to Message
- Mute Message
- Subscribe to RSS Feed
- Permalink
- Report Inappropriate Content
Any thoughts, by any chance, on this one?

