Join the Conversation
- Find Answers
- :
- Splunk Administration
- :
- Getting Data In
- :
- Why did my indexers have a large spike in io?
- Subscribe to RSS Feed
- Mark Topic as New
- Mark Topic as Read
- Float this Topic for Current User
- Bookmark Topic
- Subscribe to Topic
- Mute Topic
- Printer Friendly Page
- Mark as New
- Bookmark Message
- Subscribe to Message
- Mute Message
- Subscribe to RSS Feed
- Permalink
- Report Inappropriate Content
Why did my indexers have a large spike in io?
Hi Folks;
Wondering if someone could help me out here. I just had a big issue with Splunk. 3 of my Indexers just crashed for a bit (replication factor of 3). One of the services crashed with a bucket replication error (i fixed this), server 2 the service crashed and was simply restarted, server 3 completely got hung and required a reboot.
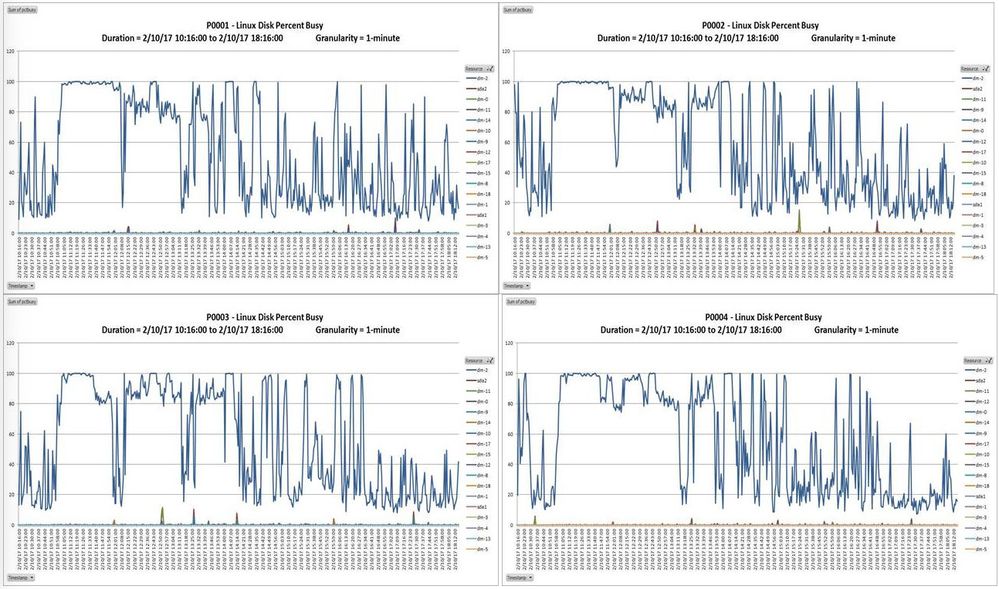
After taking a quick peek, all of the stats are looking 'normal' including cpu/ physical/ storage, however, there was something that jumped out at me which was the iostats:
Any particular reason this would start to happen? I just checked my forwarders and I dont see anything out of the ordinary with a large ramp in data ingestion
I am working with my Linux team to restore one of my servers and they are stating that there was a "kernel level CPU soft lockup"
Any Advice would be helpful in triaging this!
- Mark as New
- Bookmark Message
- Subscribe to Message
- Mute Message
- Subscribe to RSS Feed
- Permalink
- Report Inappropriate Content
Out of curiosity, is this with virtual storage, say a SAN on the backend?
Reason I ask, this is consistent across your whole indexing tier, at the same time. So Id either look at data ingestion to see if you had a huge spike in ingestion, or if something else occured with the underlying infra. If its SAN, or shared storage on a platform like VMware, perhaps there was some type of controller issue that happened....
Support should be able to help also. Keep us updated.
- Mark as New
- Bookmark Message
- Subscribe to Message
- Mute Message
- Subscribe to RSS Feed
- Permalink
- Report Inappropriate Content
- Mark as New
- Bookmark Message
- Subscribe to Message
- Mute Message
- Subscribe to RSS Feed
- Permalink
- Report Inappropriate Content
I think the crucial question is when the excessive I/O started; before or after the first failure. If a host fails, Splunk is going to immediately begin trying to get back to the intended replication and search factors to protect your data. That could be a hard-hitting process if you have a lot of data and you're on shared disk. I imagine it could lead to a chain reaction in an extreme case. Actually, if you're on shared disk I wonder if someone else might have triggered this; what kind of storage are you working with?
- Mark as New
- Bookmark Message
- Subscribe to Message
- Mute Message
- Subscribe to RSS Feed
- Permalink
- Report Inappropriate Content
I am almost positive that we are on dedicated LUNs for our Splunk servers, but I will certainly validate. Also, the screenshot above is my production environment, which was not part of the outage that I mentioned in my first post. Sorry for the confusion.
- Mark as New
- Bookmark Message
- Subscribe to Message
- Mute Message
- Subscribe to RSS Feed
- Permalink
- Report Inappropriate Content
- Mark as New
- Bookmark Message
- Subscribe to Message
- Mute Message
- Subscribe to RSS Feed
- Permalink
- Report Inappropriate Content
Really interesting. We had recently a similar situation.
This query can help in identifying stress on the indexers. If you run it for the past week, it would be interesting to see the results -
index=_internal group=queue blocked name=indexqueue | timechart count by host
In our case, the indexers' queues got filled up and the 9997 port on some of them were closed for a couple of days. Only bouncing the indexers opened up the 9997 ports. You can run the following - netstat -plnt | grep 9997 to check whether they are open. We also created a monitoring page for the 9997 ports to detect this type of situation. We increased the indexers' queues and we are doing much better.
Support recommends to run iostat 1 5 and they say that %iowait shouldn't pass 1% consistently over time . They didn't explain the reasoning behind the threshold of the 1%.
- Mark as New
- Bookmark Message
- Subscribe to Message
- Mute Message
- Subscribe to RSS Feed
- Permalink
- Report Inappropriate Content
Thanks for the quick response as always!! I have updated my original post with the query results for both my production environment and my test environment.


