- Find Answers
- :
- Splunk Administration
- :
- Getting Data In
- :
- Why are the Universal Forwarders CPU spiking every...
- Subscribe to RSS Feed
- Mark Topic as New
- Mark Topic as Read
- Float this Topic for Current User
- Bookmark Topic
- Subscribe to Topic
- Mute Topic
- Printer Friendly Page
- Mark as New
- Bookmark Message
- Subscribe to Message
- Mute Message
- Subscribe to RSS Feed
- Permalink
- Report Inappropriate Content
Hi,
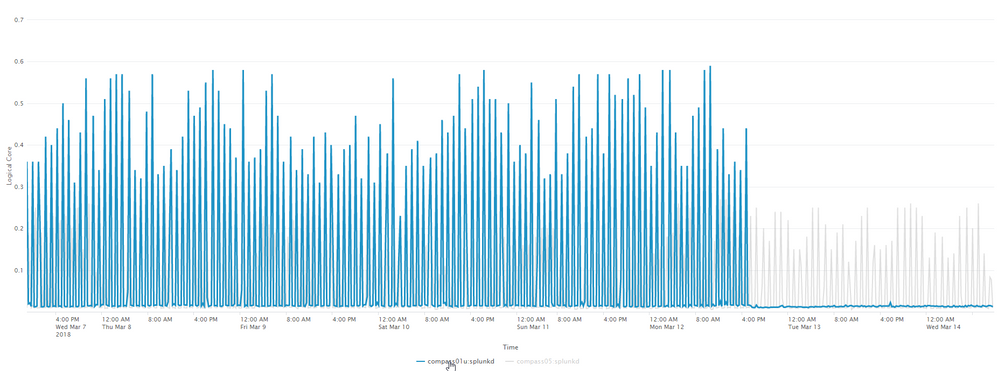
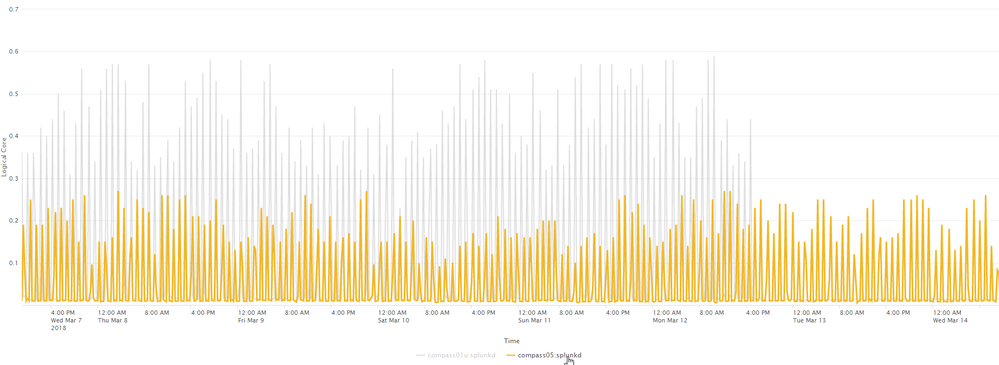
I have over 150+ UF and they all behave the same. splunkd CPU usage is about 5% but every hour it spikes, up to 50-60%. This has been going on for many months. I have AIX and Linux UF and they all behave the same.
If I do a fresh install, it doesn't do that. But over time, the spike starts to happen. Recently, to test, I upgraded two AIX UF from version 6.5.2 to 7.0.2.
On one, I wiped out the entire install folder, basically started from scratch. There is no more spike on this one (but only a matter of time before it does it again).
On another, I simply upgraded over the existing install. The spike remained the same.
Something in splunkd is using more CPU over time, every hour. I would like to know what it is so I can possibly disable/play with it. splunkd CPU usage on my servers needs to be as low as possible.
Are people using UF on AIX and Linux seeing this too?
Below: UF that I wiped clean before reinstalling. We can see the spikes stoping after fresh install.
Below: UF that I simply upgraded. Spikes remains.
- Mark as New
- Bookmark Message
- Subscribe to Message
- Mute Message
- Subscribe to RSS Feed
- Permalink
- Report Inappropriate Content
You are likely seeing a spike in I/O and CPU from the fishbucket snapshot every hour, can you check $SPLUNK_HOME/var/lib/splunk/_fishbucket , in particular I believe it's the directory:
$SPLUNK_HOME/var/lib/splunk/_fishbucket/splunk_private_db/snapshot
That you should see the timestamp on changing every hour, see it if matches the timing of the spikes.
- Mark as New
- Bookmark Message
- Subscribe to Message
- Mute Message
- Subscribe to RSS Feed
- Permalink
- Report Inappropriate Content
Yes! Finally some hint of what's going on! Now more questions:
What exactly is it doing and anyway I can stop it or change some settings or something?
- Mark as New
- Bookmark Message
- Subscribe to Message
- Mute Message
- Subscribe to RSS Feed
- Permalink
- Report Inappropriate Content
Hi there, you could always start an universal forwarder in debug mode http://docs.splunk.com/Documentation/Splunk/7.0.2/Troubleshooting/Enabledebuglogging#Enable_debug_lo...
but be aware, as stated in the docs, this will produce even more load on the server. Running in debug mode should also not be done on production servers nor over a longer time.
This might get you more information about what is going on when you see these spikes.
cheers, MuS
- Mark as New
- Bookmark Message
- Subscribe to Message
- Mute Message
- Subscribe to RSS Feed
- Permalink
- Report Inappropriate Content
You can certainly change some settings, however I do not believe you can control the snapshot interval!
I've discussed the fishbucket and related items in a couple of Splunk cases and I understand the basics but I do not work for Splunk so feel free so do keep this in mind...
So from what I do understand there are scenarios that can corrupt the fishbucket, and I would assume the hourly snapshot might have something to do with dealing with this scenario but I am not sure.
The setting you can definitely control is in the limits.conf file, the file_tracking_db_threshold_mb setting.
Using this setting you can increase or decrease the size of your fishbucket.
However before tweaking this setting you need to understand your system and what the fishbucket does, if you make the fishbucket too small you will re-read files you have already seen, make it larger and you will have a larger CPU spike.
Perhaps you could create a new question to see if anyone has a more exact answer around the hourly fishbucket snapshots?
- Mark as New
- Bookmark Message
- Subscribe to Message
- Mute Message
- Subscribe to RSS Feed
- Permalink
- Report Inappropriate Content
Can you share your monitor stanza?
Are you using wildcards for monitoring?
- Mark as New
- Bookmark Message
- Subscribe to Message
- Mute Message
- Subscribe to RSS Feed
- Permalink
- Report Inappropriate Content
I removed all my custom inputs and it still peaks every hour. What remains is only what the UF is configured to monitor by default: its own internal logs. Below output of splunk list monitor:
Monitored Directories:
        $SPLUNK_HOME/var/log/splunk
                /opt/splunkforwarder/var/log/splunk/audit.log
                /opt/splunkforwarder/var/log/splunk/btool.log
                /opt/splunkforwarder/var/log/splunk/conf.log
                /opt/splunkforwarder/var/log/splunk/first_install.log
                /opt/splunkforwarder/var/log/splunk/license_usage.log
                /opt/splunkforwarder/var/log/splunk/metrics.log.1
                /opt/splunkforwarder/var/log/splunk/metrics.log.2
                /opt/splunkforwarder/var/log/splunk/metrics.log.3
                /opt/splunkforwarder/var/log/splunk/metrics.log.4
                /opt/splunkforwarder/var/log/splunk/metrics.log.5
                /opt/splunkforwarder/var/log/splunk/migration.log.2018-03-12.16-21-24
                /opt/splunkforwarder/var/log/splunk/mongod.log
                /opt/splunkforwarder/var/log/splunk/remote_searches.log
                /opt/splunkforwarder/var/log/splunk/scheduler.log
                /opt/splunkforwarder/var/log/splunk/searchhistory.log
                /opt/splunkforwarder/var/log/splunk/splunkd-utility.log
                /opt/splunkforwarder/var/log/splunk/splunkd.log.1
                /opt/splunkforwarder/var/log/splunk/splunkd.log.2
                /opt/splunkforwarder/var/log/splunk/splunkd.log.3
                /opt/splunkforwarder/var/log/splunk/splunkd.log.4
                /opt/splunkforwarder/var/log/splunk/splunkd.log.5
                /opt/splunkforwarder/var/log/splunk/splunkd_access.log
                /opt/splunkforwarder/var/log/splunk/splunkd_stderr.log
                /opt/splunkforwarder/var/log/splunk/splunkd_stdout.log
                /opt/splunkforwarder/var/log/splunk/splunkd_ui_access.log
        $SPLUNK_HOME/var/log/splunk/license_usage_summary.log
                /opt/splunkforwarder/var/log/splunk/license_usage_summary.log
        $SPLUNK_HOME/var/log/splunk/metrics.log
                /opt/splunkforwarder/var/log/splunk/metrics.log
        $SPLUNK_HOME/var/log/splunk/splunkd.log
                /opt/splunkforwarder/var/log/splunk/splunkd.log
        $SPLUNK_HOME/var/spool/splunk/...stash_new
Monitored Files:
        $SPLUNK_HOME/etc/splunk.version
- Mark as New
- Bookmark Message
- Subscribe to Message
- Mute Message
- Subscribe to RSS Feed
- Permalink
- Report Inappropriate Content
Maybe you have an input/modular input or script with a 1 hour pooling interval ?
Or a set of monitored folders that gets updated/rotated/compressed every hour (maybe a log rotate), causing splunk to rescan the folder.
To confirm, you could disable the inputs one by one and see which one was causing the cpu spiked.
Also you can look at the _introspection splunk logs, and maybe identity the process/task using the cpu (it could be splunkd, but it could be a script)
- Mark as New
- Bookmark Message
- Subscribe to Message
- Mute Message
- Subscribe to RSS Feed
- Permalink
- Report Inappropriate Content
I removed all my inputs. The only thing remaining is splunk itself and the forwarding of internal logs. It's still doing the spikes.


