- Find Answers
- :
- Splunk Administration
- :
- Getting Data In
- :
- Re: Unable to view Nexus data in main dashboard of...
- Subscribe to RSS Feed
- Mark Topic as New
- Mark Topic as Read
- Float this Topic for Current User
- Bookmark Topic
- Subscribe to Topic
- Mute Topic
- Printer Friendly Page
- Mark as New
- Bookmark Message
- Subscribe to Message
- Mute Message
- Subscribe to RSS Feed
- Permalink
- Report Inappropriate Content
Hi there,
I've just recently installed the 'Cisco Networks' app https://splunkbase.splunk.com/app/1352/
However in the main dashboard or 'cisco networks overview' for product there is only an option for ios, wlc, ap. In the switching tab/dashboard there doesn't seem to be anything displayed for the nexus switches.
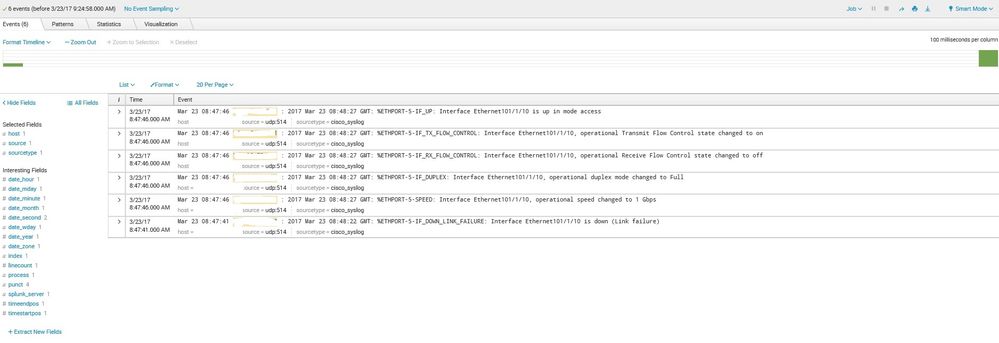
The only way I can see data from the nexus switch is in 'search' (attached) via an IP address
In the data input section in settings, I've put in the UDP port it would be received on, and the source type as 'cisco_syslog' as there didn't seem to be an option for nx-os or nexus.
Have I missed out a setting/configuration?
Thanks
Shams
- Mark as New
- Bookmark Message
- Subscribe to Message
- Mute Message
- Subscribe to RSS Feed
- Permalink
- Report Inappropriate Content
Hi,
since the post is awaiting moderation I have to post this as a comment, not an answer. Feel free to change this to an answer and accept.
You need to set the sourcetype of your data to "cisco:ios" OR "syslog". You will also need the Cisco Networks Add-on on your indexers and search head as described in the documentation.
"cisco:ios" is faster since Splunk won't need to rewrite the sourcetype based on a transform. Consider "syslog" a last resort.
As soon as this is corrected you will see your data in the Cisco Networks app. If you still don't see data you will need to make whatever index the data is stored in searched by default. This is done in Access Controls -> Roles in Splunk
- Mark as New
- Bookmark Message
- Subscribe to Message
- Mute Message
- Subscribe to RSS Feed
- Permalink
- Report Inappropriate Content
Hi,
we have the same issue and our Splunk admin followed the rules
but nevertheless all is seen as cisco:ios no difference for ios-xe or nx-os
    splunk@xxx % tail -5 props.conf
    [CC:syslog]
    TRANSFORMS-force_sourcetypes_cc = force_sourcetype_cisco_asa, force_sourcetype_for_cisco_ios, force_sourcetype_for_cisco_ios-xr, force_sourcetype_for_cisco_ios-xe
    SHOULD_LINEMERGE = false
    KV_MODE = none
    TZ = UTC
So any clue what's wrong ?
We had also updated App and Add-on to 2.5.8
Do I have to ask a new question or does this still fit to this post ?
- Mark as New
- Bookmark Message
- Subscribe to Message
- Mute Message
- Subscribe to RSS Feed
- Permalink
- Report Inappropriate Content
Hi,
since the post is awaiting moderation I have to post this as a comment, not an answer. Feel free to change this to an answer and accept.
You need to set the sourcetype of your data to "cisco:ios" OR "syslog". You will also need the Cisco Networks Add-on on your indexers and search head as described in the documentation.
"cisco:ios" is faster since Splunk won't need to rewrite the sourcetype based on a transform. Consider "syslog" a last resort.
As soon as this is corrected you will see your data in the Cisco Networks app. If you still don't see data you will need to make whatever index the data is stored in searched by default. This is done in Access Controls -> Roles in Splunk
- Mark as New
- Bookmark Message
- Subscribe to Message
- Mute Message
- Subscribe to RSS Feed
- Permalink
- Report Inappropriate Content
Excellent thanks! that works! I got the 'add-on' and change the source type and now I can see events in the main dashboard. Thankyou

