- Find Answers
- :
- Splunk Administration
- :
- Getting Data In
- :
- The monitor input cannot produce data because splu...
- Subscribe to RSS Feed
- Mark Topic as New
- Mark Topic as Read
- Float this Topic for Current User
- Bookmark Topic
- Subscribe to Topic
- Mute Topic
- Printer Friendly Page
- Mark as New
- Bookmark Message
- Subscribe to Message
- Mute Message
- Subscribe to RSS Feed
- Permalink
- Report Inappropriate Content
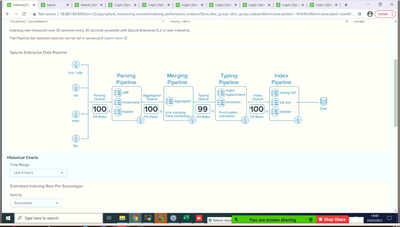
The monitor input cannot produce data because splunkd's processing queues are full. This will be caused by inadequate in
The monitor input cannot produce data because splunkd's processing queues are full. This will be caused by inadequate indexing or forwarding rate, or a sudden burst of incoming data.
- Mark as New
- Bookmark Message
- Subscribe to Message
- Mute Message
- Subscribe to RSS Feed
- Permalink
- Report Inappropriate Content
HI @imam99,
there could be many reasons for your problem, the most likely are insuffient resources especially CPUs and too low performances of your disks:
for the first one, you have to performa a Capacity Plan to understand if the number of CPUs that you have is sufficient to manage the ingestion and search load, how many CPUs, GB/day have you, users and scheduled searches have you? have ES or ITSI?
For the second one, Splunk requires at least 800 IOPS (better 1200) for the storage of Hot and Warm Buckets, how many IOPS has your storage? you can test it using tools as bonnie++.
Anyway, after the above checks (because they will ask you them), I hint to open a case to Splunk Support because maybe there could be some other problem, e.g. I had the same problem caused by syslog sending to third party.
Ciao.
Giuseppe
- Mark as New
- Bookmark Message
- Subscribe to Message
- Mute Message
- Subscribe to RSS Feed
- Permalink
- Report Inappropriate Content
thank you for your feedback, I'm agree with you, that it seems my server resources is not enough, coz during this happen I found cpu consumption more that 100% (using top command), but now cpu usage has been normal condition, but doesn't know why Splunk didn't released the queue and till now the error message still happen
- Mark as New
- Bookmark Message
- Subscribe to Message
- Mute Message
- Subscribe to RSS Feed
- Permalink
- Report Inappropriate Content
Hi @imam99,
as I said i encountered a similar problem because also my queues didn't empty after the block.
For this reason I hinted to open a Case To Splunk, to understand if it's possible to do something.
In my Use Case they hinted to use the parallel pipeline and surely helps you if you have sufficient CPUs, but it depends on your resources and it's a delicate tuning.
Did you perform a Capacity Planning?
The questions are
- How many CPUs (totally in all your indexers),
- how many GB/day,
- how many GB in the peak hour,
- how manu users,
- how many scheduled searches,
- are there ES or ITSI.
Ciao.
Giuseppe
- Mark as New
- Bookmark Message
- Subscribe to Message
- Mute Message
- Subscribe to RSS Feed
- Permalink
- Report Inappropriate Content
thank you for your answer but ,at this time all input data has stopped, we already stopped all the incoming logs, then just said it was checked, the write disk iops was 50 Mbps, the current CPU and memory positions have dropped. But indexQueue is still full.
- Mark as New
- Bookmark Message
- Subscribe to Message
- Mute Message
- Subscribe to RSS Feed
- Permalink
- Report Inappropriate Content
Hi @imam99,
you if you restart the Indexers the queues will be empty and indexing will restart, but it doesn't resolve the problem.
But anyway, open a case to Splunk Support at P1 level (blocked system) they usually answers in 30-60 minutes.
Ciao.
Giuseppe
- Mark as New
- Bookmark Message
- Subscribe to Message
- Mute Message
- Subscribe to RSS Feed
- Permalink
- Report Inappropriate Content
Hi Ciao
thx , i will try you're suggestion
Imam Mustakim
- Mark as New
- Bookmark Message
- Subscribe to Message
- Mute Message
- Subscribe to RSS Feed
- Permalink
- Report Inappropriate Content
Is there a question here?


