- Find Answers
- :
- Splunk Administration
- :
- Getting Data In
- :
- Network folder monitoring
- Subscribe to RSS Feed
- Mark Topic as New
- Mark Topic as Read
- Float this Topic for Current User
- Bookmark Topic
- Subscribe to Topic
- Mute Topic
- Printer Friendly Page
- Mark as New
- Bookmark Message
- Subscribe to Message
- Mute Message
- Subscribe to RSS Feed
- Permalink
- Report Inappropriate Content
Network folder monitoring
Hello Splunker
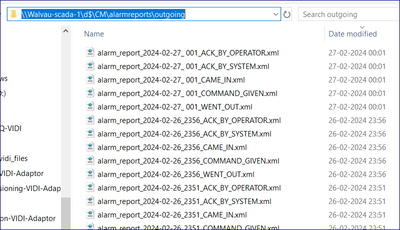
In my request, I want to monitor the below files, which are under the network folder. I have configured indexes.conf, props.conf, inputs.conf & transforms.conf but nothing is working for me to get data into Splunk. Please check my config and help or suggest me if any changes are required.
inputs.conf :
[monitor://\\WALVAU-SCADA-1\d$\CM\alarmreports\outgoing*]
disabled = false
index = scada
host = WALVAU-SCADA-1
sourcetype = cm_scada_xml
indexes.conf :
[scada]
coldPath = $SPLUNK_DB/scada/colddb
enableDataIntegrityControl = 0
enableTsidxReduction = 0
homePath = $SPLUNK_DB/scada/db
maxTotalDataSizeMB = 512000
thawedPath = $SPLUNK_DB/scada/thaweddb
props.conf :
[cm_scada_xml]
KEEP_EMPTY_VALS = false
KV_MODE = xml
LINE_BREAKER = <\/eqtext:EquipmentEvent>()
MAX_TIMESTAMP_LOOKAHEAD = 24
NO_BINARY_CHECK = true
SEDCMD-first = s/^.*<eqtext:EquipmentEvent/<eqtext:EquipmentEvent/g
SHOULD_LINEMERGE = false
TIME_FORMAT = %Y-%m-%dT%H:%M:%S.%3f%Z
TIME_PREFIX = ((?<!ReceiverFmInstanceName>))<eqtext:EventTime>
TRUNCATE = 100000000
category = Custom
disabled = false
pulldown_type = true
TRANSFORMS-remove-xml-footer = remove-xml-footer
TRANSFORMS-keep-came-in-and-went-out-states = keep-came-in-and-went-out-states
FIELDALIAS-fields_scada_xml = "eqtext:EquipmentEvent.eqtext:ID.eqtext:Location.eqtext:PhysicalLocation.AreaID" AS area "eqtext:EquipmentEvent.eqtext:ID.eqtext:Location.eqtext:PhysicalLocation.ElementID" AS element "eqtext:EquipmentEvent.eqtext:ID.eqtext:Location.eqtext:PhysicalLocation.EquipmentID" AS equipment "eqtext:EquipmentEvent.eqtext:ID.eqtext:Location.eqtext:PhysicalLocation.ZoneID" AS zone "eqtext:EquipmentEvent.eqtext:ID.eqtext:Description" AS description "eqtext:EquipmentEvent.eqtext:ID.eqtext:MIS_Address" AS mis_address "eqtext:EquipmentEvent.eqtext:Detail.State" AS state "eqtext:EquipmentEvent.eqtext:Detail.eqtext:EventTime" AS event_time "eqtext:EquipmentEvent.eqtext:Detail.eqtext:MsgNr" AS msg_nr "eqtext:EquipmentEvent.eqtext:Detail.eqtext:OperatorID" AS operator_id "eqtext:EquipmentEvent.eqtext:Detail.ErrorType" AS error_type "eqtext:EquipmentEvent.eqtext:Detail.Severity" AS severity
transforms.conf :
[remove-xml-footer]
REGEX = <\/eqtexo:EquipmentEventReport>
DEST_KEY = queue
FORMAT = nullQueue
[keep-came-in-and-went-out-states]
REGEX = <State>(?!CAME_IN|WENT_OUT).*?<\/State>
DEST_KEY = queue
FORMAT = nullQueue
- Mark as New
- Bookmark Message
- Subscribe to Message
- Mute Message
- Subscribe to RSS Feed
- Permalink
- Report Inappropriate Content
Ingesting files over the network from CIFS share can be tricky.
1) Too many monitored files cause performance issues (but that might be an issue when it works in the first place)
2) The user the splunkd.exe process runs with must be able to access the share. Since there is no additional authentication possible it works only in a domain environment if you run the forwarder process under domain account and grant this account proper permissions to the share (could also work - never tried it - if the share was public but that's not a good idea).
- Mark as New
- Bookmark Message
- Subscribe to Message
- Mute Message
- Subscribe to RSS Feed
- Permalink
- Report Inappropriate Content
Hi @uagraw01,
please could you better describe your architecture?
have you a stand alone Splunk server?
have you a Forwarder or folders to monitor are accessed by the Splunk server?
which user are you usig to run Splunk on the the system accessing the folders to monior? have this user the grants to read the files?
Ciao.
Giuseppe
- Mark as New
- Bookmark Message
- Subscribe to Message
- Mute Message
- Subscribe to RSS Feed
- Permalink
- Report Inappropriate Content
@gcusello I have a standalone Windows Splunk server, and from the same server I can able to access the network folder as provided in the screenshot earlier.
- Mark as New
- Bookmark Message
- Subscribe to Message
- Mute Message
- Subscribe to RSS Feed
- Permalink
- Report Inappropriate Content
Hi @uagraw01 ,
please try to use this header in the inputs.conf stanza:
[monitor://\\WALVAU-SCADA-1\d$\CM\alarmreports\outgoing\*.xml]Ciao.
Giuseppe
- Mark as New
- Bookmark Message
- Subscribe to Message
- Mute Message
- Subscribe to RSS Feed
- Permalink
- Report Inappropriate Content
@gcusello I have already tested by adding the below string to the monitoring stranza. But no luck was found.
- Mark as New
- Bookmark Message
- Subscribe to Message
- Mute Message
- Subscribe to RSS Feed
- Permalink
- Report Inappropriate Content
Hi @uagraw01 ,
as @PickleRick said, check if the user you're using to run Splunk has the grants to access the shared folder,
Then think to use a Universal Forwarder on the server that has the shared folder: is more sure and efficient.
Ciao.
Giuseppe
- Mark as New
- Bookmark Message
- Subscribe to Message
- Mute Message
- Subscribe to RSS Feed
- Permalink
- Report Inappropriate Content
@gcusello
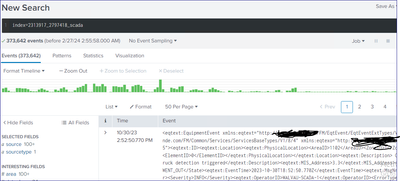
Till to 10/30/2023 we received the events by using the same approach but the same I am using the same configuration settings but nothing worked at all.
- Mark as New
- Bookmark Message
- Subscribe to Message
- Mute Message
- Subscribe to RSS Feed
- Permalink
- Report Inappropriate Content
Hi @uagraw01 ,
probably something changed!
analyze from scratch the input, starting from thetimestamp, that I dont see where it comes from.
Ciao.
Giuseppe
- Mark as New
- Bookmark Message
- Subscribe to Message
- Mute Message
- Subscribe to RSS Feed
- Permalink
- Report Inappropriate Content
@gcusello @PickleRick I have changed my approach. I have used one script which copy the files from the network folder and paste it to local folder and changed the monitoring stranza in inputs.conf but this also not worked. Below I changed in inputs.conf
[monitor://C:\Windows\Temp\outgoing\*.xml]
disabled = false
index = new_demo_scada
host = VIDI
sourcetype = new_demo_scada
props & transform remains same.
- Mark as New
- Bookmark Message
- Subscribe to Message
- Mute Message
- Subscribe to RSS Feed
- Permalink
- Report Inappropriate Content
OK.
1. I assume you restarted the UF after doing all those config changes.
2. Do you get any other data from this forwarder?
- Mark as New
- Bookmark Message
- Subscribe to Message
- Mute Message
- Subscribe to RSS Feed
- Permalink
- Report Inappropriate Content
@PickleRick I restarted the Splunk standalone server where I put the files.
- Mark as New
- Bookmark Message
- Subscribe to Message
- Mute Message
- Subscribe to RSS Feed
- Permalink
- Report Inappropriate Content
Hi @uagraw01,
If there are too many files in that folder you can try adding "ignoreOlderThan" setting in monitor stanza;
[monitor://\\WALVAU-SCADA-1\d$\CM\alarmreports\outgoing*]
disabled = false
index = scada
host = WALVAU-SCADA-1
sourcetype = cm_scada_xml
ignoreOlderThan = 24h- Mark as New
- Bookmark Message
- Subscribe to Message
- Mute Message
- Subscribe to RSS Feed
- Permalink
- Report Inappropriate Content
@scelikok I tried but No luck found.
- Mark as New
- Bookmark Message
- Subscribe to Message
- Mute Message
- Subscribe to RSS Feed
- Permalink
- Report Inappropriate Content
Anyway, regardless of the reason, if it used to work and stop, it would be prudent to troubleshoot for the cause instead of blindly trying to add a setting here and there.
Check your splunkd.log on the forwarder for errors. Check output of
splunk list inputstatus
and
splunk list monitor
- Mark as New
- Bookmark Message
- Subscribe to Message
- Mute Message
- Subscribe to RSS Feed
- Permalink
- Report Inappropriate Content
@PickleRick
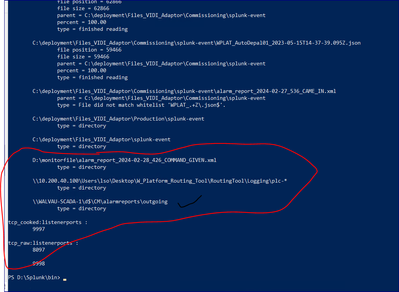
I am getting below issues while executing your suggested command "splunk list inputstatus" . Can you please tell me what issue you can see by referring to below screenshot?
- Mark as New
- Bookmark Message
- Subscribe to Message
- Mute Message
- Subscribe to RSS Feed
- Permalink
- Report Inappropriate Content
Permissions issue?
- Mark as New
- Bookmark Message
- Subscribe to Message
- Mute Message
- Subscribe to RSS Feed
- Permalink
- Report Inappropriate Content
@PickleRick Does the highlighted things are related to permission related issue ?
- Mark as New
- Bookmark Message
- Subscribe to Message
- Mute Message
- Subscribe to RSS Feed
- Permalink
- Report Inappropriate Content
See further up if there are any files from those directories listed.
- Mark as New
- Bookmark Message
- Subscribe to Message
- Mute Message
- Subscribe to RSS Feed
- Permalink
- Report Inappropriate Content
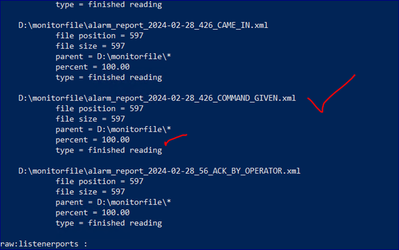
Below is a screenshot of test server files being perfectly monitored in Splunk.
Below screenshot belongs to production server and the same file creating an issue for monitoring in Splunk(issued server).
- Mark as New
- Bookmark Message
- Subscribe to Message
- Mute Message
- Subscribe to RSS Feed
- Permalink
- Report Inappropriate Content
That's _not_ what I was saying. If something is OK in one environment and not OK in another you must compare differences between environments.


