Join the Conversation
- Find Answers
- :
- Splunk Administration
- :
- Getting Data In
- :
- Re: Need help parsing and extracting MongoDB JSON ...
- Subscribe to RSS Feed
- Mark Topic as New
- Mark Topic as Read
- Float this Topic for Current User
- Bookmark Topic
- Subscribe to Topic
- Mute Topic
- Printer Friendly Page
- Mark as New
- Bookmark Message
- Subscribe to Message
- Mute Message
- Subscribe to RSS Feed
- Permalink
- Report Inappropriate Content
Need help parsing and extracting MongoDB JSON log in Splunk
Hi,
I need some help.
We have been using Splunk for MongoDB alert for a while, now the new MongoDB version we are upgrading to is changing the log format from text to JSON.
I need to alter the alert in Splunk so that it will continue to work with the new JSON log format.
Here is an example of a search query in one of the alert we have now:
index=googlecloud*
source="projects/dir1/dir2/mongodblogs"
data.logName="projects/dir3/logs/mongodb"
data.textPayload="* REPL *"
NOT "catchup takeover"
| rex field=data.textPayload "(?<sourceTimestamp>\d{4}-\d*-\d*T\d*:\d*:\d*.\d*)-\d*\s*(?<severity>\w*)\s*(?<component>\w*)\s*(?<context>\S*)\s*(?<message>.*)"
| search component="REPL"
message!="*took *ms"
message!="warning: log line attempted * over max size*"
NOT (severity="I" AND message="applied op: CRUD*" AND message!="*took *ms")
| rename data.labels.compute.googleapis.com/resource_name as server
| regex server="^preprod0[12]-.+-mongodb-server8*\d$"
| sort sourceTimestamp data.insertId
| table sourceTimestamp server severity component context message
The content of the MongoDB log is under data.TextPayload, currently is being formatted using regex and split into 5 groups with labels and then we search from each group for the string or message that we want to be alerted on.
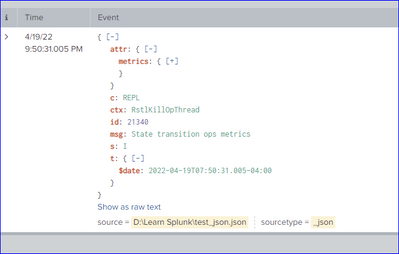
The new JSON format log looks like this:
{"t":{"$date":"2022-04-19T07:50:31.005-04:00"},"s":"I", "c":"REPL", "id":21340, "ctx":"RstlKillOpThread","msg":"State transition ops metrics","attr":{"metrics":{"lastStateTransition":"stepDown","userOpsKilled":0,"userOpsRunning":4}}}
I need to split them into 7 groups, using comma as delimiter and then search from each group using the same search criteria.
I have been trying and testing for 2 days, I'm new to Splunk and not very good in regex.
Any help would be appreciated.
Thanks !
Sally
- Mark as New
- Bookmark Message
- Subscribe to Message
- Mute Message
- Subscribe to RSS Feed
- Permalink
- Report Inappropriate Content
I got this one working now with below:
sourcetype=json
| spath input="data.textPayload" output="Timestamp" path=t
| spath input="data.textPayload" output="Severity" path=s
| spath input="data.textPayload" output="Component" path=c
| spath input="data.textPayload" output="Context" path=ctx
| spath input="data.textPayload" output="Message" path=msg
| spath input="data.textPayload" output="Attr" path=attr
| search < Search criteria by field here>
| table Timestamp Server Severity Component Context Message Attr
Thanks !
- Mark as New
- Bookmark Message
- Subscribe to Message
- Mute Message
- Subscribe to RSS Feed
- Permalink
- Report Inappropriate Content
Hi @ychoo
I think you'll need to update the sourcetype for the log from text to json to correctly parse the logs looking at a good long term solution.
If not you can proceed with using spath or regex for field extractions.
source="D:\\Learn Splunk\\test.txt"  sourcetype="text"
| rex field=_raw "date\"\:\"(?P<SourceTimestamp>[\d\-\:\.T]+)\"\},\"s\"\:\"(?P<Severity>[\w]+)\",\s\"c\"\:\"(?P<Component>[\w]+)"
| rex field=_raw "ctx\"\:\"(?P<Context>[\w]+)\",\"msg\"\:\"(?P<Message>[\w\s]+)"
| table _time SourceTimestamp Severity Component Context Message


