- Find Answers
- :
- Splunk Administration
- :
- Getting Data In
- :
- How to use mpstats results in table view in Splunk...
- Subscribe to RSS Feed
- Mark Topic as New
- Mark Topic as Read
- Float this Topic for Current User
- Bookmark Topic
- Subscribe to Topic
- Mute Topic
- Printer Friendly Page
- Mark as New
- Bookmark Message
- Subscribe to Message
- Mute Message
- Subscribe to RSS Feed
- Permalink
- Report Inappropriate Content
How to use mpstats results in table view in Splunk dashboard?
Hi Friends,
I'm configuring mpstats command to get the each cpu core ideal value.
I have configured below in bin folder:
cpucore_mpstat.sh
mpstat -P ALL
Input.cong:
# This script will collect cpu utilization per core from mpstat command
[script://./bin/cpucore_mpstat.sh]
disabled = false
interval = 120
source = server
sourcetype = cpucore_mpstat
index = pg_idx_whse_prod_events
_meta = entity_type::NIX service_name::WHSE environment::PROD
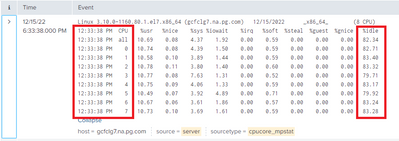
I can see the events like below:
I want red box highlighted column needs to display in dashboard. Kindly help on this how to achieve this.
- Mark as New
- Bookmark Message
- Subscribe to Message
- Mute Message
- Subscribe to RSS Feed
- Permalink
- Report Inappropriate Content
Hi @Jagadeesh2022 ,
you can use the kvform command (https://docs.splunk.com/Documentation/Splunk/9.0.2/SearchReference/Kvform), something like this:
<your-search>
| kvform field=CPU field="%idle"
Ciao.
Giuseppe
- Mark as New
- Bookmark Message
- Subscribe to Message
- Mute Message
- Subscribe to RSS Feed
- Permalink
- Report Inappropriate Content
Thanks for your suggestion. Its not working for me.
Now my event is like below:
Linux 3.10.0-1160.80.1.el7.x86_64 (aelg3.eu.pg.com) 05:57:31 PM CPU %idle 05:57:31 PM all 95.37 05:57:31 PM 0 96.25 05:57:31 PM 1 95.54 05:57:31 PM 2 96.20 05:57:31 PM 3 95.14 05:57:31 PM 4 93.33 05:57:31 PM 5 95.74 |
Could you please suggest how to use regex and get column name and all values as output to display in dashboard?
Thanks in advance.
- Mark as New
- Bookmark Message
- Subscribe to Message
- Mute Message
- Subscribe to RSS Feed
- Permalink
- Report Inappropriate Content
Hi @Jagadeesh2022,
regexes aren't usable for this request,
but why the result you have is different from your request?
in other words in what the result differs from your need?
Ciao.
Giuseppe
- Mark as New
- Bookmark Message
- Subscribe to Message
- Mute Message
- Subscribe to RSS Feed
- Permalink
- Report Inappropriate Content
Hi @gcusello ,
While I use this search :
index="pg_idx_whse_prod_events" source=server sourcetype=cpucore_mpstat
| kvform field=CPU field="%idle"
I'm getting below error :
Error in 'SearchProcessor': Option 'field' should not be specified more than once.
My expected results should be:
| Time | CPU core | %Idle |
| 05:57:31 PM | all | 95.37 |
| 05:57:31 PM | 0 | 96.25 |
| 05:57:31 PM | 1 | 95.54 |
| 05:57:31 PM | 2 | 96.20 |
| 05:57:31 PM | 3 | 95.14 |
Some host have 8 core so we will get 0,1,2,3,..7 rows,
Some host have 32 core so we will get all, 0, 1,2,3,....30,31 rows
Please help me how to achieve this.
Thanks in advance.

