Join the Conversation
- Find Answers
- :
- Splunk Administration
- :
- Getting Data In
- :
- How to set up TCP monitoring in Splunk Light Cloud...
- Subscribe to RSS Feed
- Mark Topic as New
- Mark Topic as Read
- Float this Topic for Current User
- Bookmark Topic
- Subscribe to Topic
- Mute Topic
- Printer Friendly Page
- Mark as New
- Bookmark Message
- Subscribe to Message
- Mute Message
- Subscribe to RSS Feed
- Permalink
- Report Inappropriate Content
How to set up TCP monitoring in Splunk Light Cloud?
Hello,
I am an experienced Splunk Enterprise user and administrator using Splunk Cloud Light for the first time.
I am trying to follow the directions here to set up monitoring a syslog stream via TCP to monitor a Heroku instance.
http://docs.splunk.com/Documentation/SplunkLight/6.4.0/GettingStarted/Monitornetworkports
The process is described in a Splunk Blog entry here: http://blogs.splunk.com/2014/04/10/splunking-heroku/
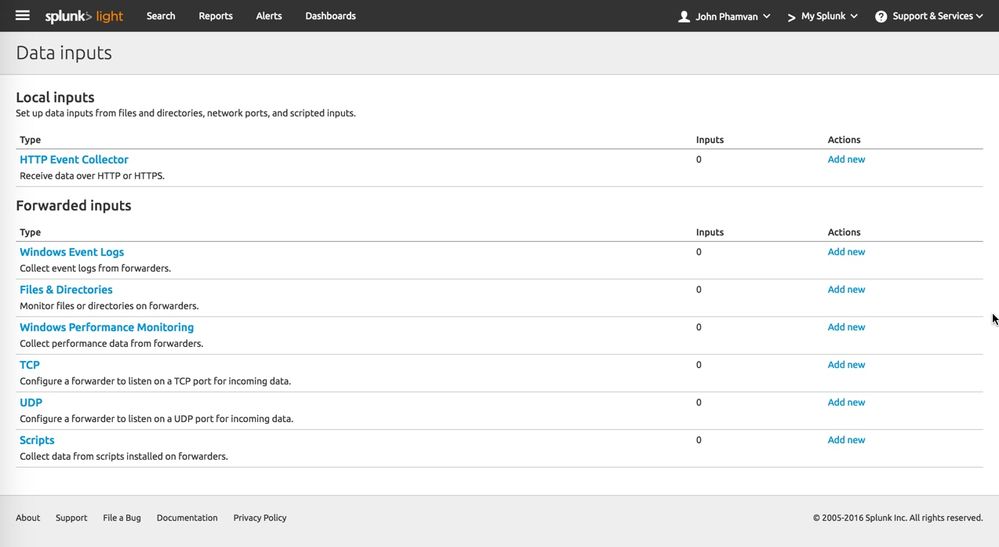
Clicking Add New next to TCP on this screen
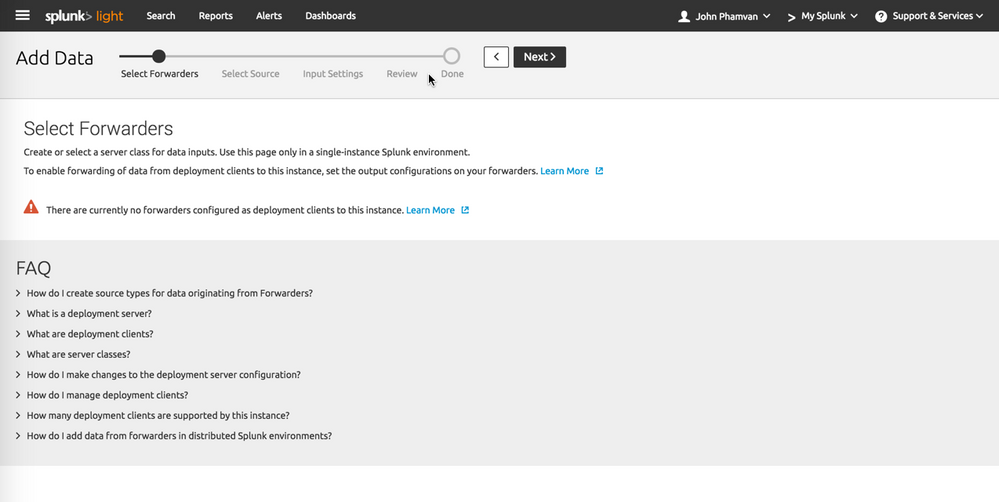
Takes me to a selection screen for Forwarders, but I simply need the monitoring not the forwarder configuration.
Also following the directions on this screen doesn't show a TCP option (only HTTP):
https://my-instance.cloud.splunk.com/en-US/manager/search/adddata/selectsource?input_mode=1
This person also seemed to encounter the same UI bug as me, but he is actually trying to configure a forwarder whereas I am not. https://answers.splunk.com/answers/390942/how-to-configure-a-forwarder-to-listen-on-tcpudp-f.html
Please advise.
Thank you,
John
- Mark as New
- Bookmark Message
- Subscribe to Message
- Mute Message
- Subscribe to RSS Feed
- Permalink
- Report Inappropriate Content
Hello John,
In Cloud deployment, TCP monitoring is not supported.
You options are to either to use HTTP Event Collector, (I believe hiroku supports HTTPS data drains).
Or, you can host a Splunk Forwarder, and enable TCP input for receiving hiroku data as syslog (which will then route it to your Splunk Light cloud instance).
HTH,
-Dhananjay


