- Find Answers
- :
- Splunk Administration
- :
- Getting Data In
- :
- How to implement whitelist instead of blacklist fo...
- Subscribe to RSS Feed
- Mark Topic as New
- Mark Topic as Read
- Float this Topic for Current User
- Bookmark Topic
- Subscribe to Topic
- Mute Topic
- Printer Friendly Page
- Mark as New
- Bookmark Message
- Subscribe to Message
- Mute Message
- Subscribe to RSS Feed
- Permalink
- Report Inappropriate Content
How to implement whitelist instead of blacklist for Splunk Plugin for Jenkins?
The Splunk plugin for Jenkins implements a blacklist model for determining which Jobs send their information to Splunk (i.e. regex where matching jobs will be ignored) - is there a way to implement whitelist model that isn't just horrendous regex? I'm looking to only send to Splunk for a few Jobs out of many.
- Mark as New
- Bookmark Message
- Subscribe to Message
- Mute Message
- Subscribe to RSS Feed
- Permalink
- Report Inappropriate Content
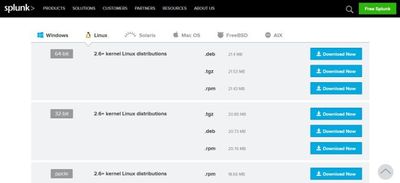
Visit the Splunk download page to download the Splunk .deb package:
Upload the file to your Ubuntu server and place it a temporary directory.
Run the dpkg command to install the Splunk server. The file name of the .deb file may change as new versions are made available so make sure that you have downloaded.
# dpkg -i splunk-7.1.1-8f0ead9ec3db-linux-2.6-amd64.deb
Selecting previously unselected package splunk.
(Reading database ... 51260 files and directories currently installed.)
Preparing to unpack splunk-7.1.1-8f0ead9ec3db-linux-2.6-amd64.deb ...
Unpacking splunk (7.1.1) ...
Setting up splunk (7.1.1) ...
Complete
Now lets create the init.d script so that we can easily start and stop Splunk. Change the the Splunk directory and run the splunk executable with the below arguments.
# cd /opt/splunk/bin/
# ./splunk enable boot-start
Press SPACE to view all of the license agreement and then Y to accept it. And it will ask for password to setup admin dashboard. Once it done, you can see confirmation like below
Moving '/opt/splunk/share/splunk/search_mrsparkle/modules.new' to '/opt/splunk/share/splunk/search_mrsparkle/modules'.
Init script installed at /etc/init.d/splunk.
Init script is configured to run at boot.
Start Splunk with the service command.
# /etc/init.d/splunk start
You will now be able to access Splunk’s web GUI which is running on port 8000.
Open the URL in the browser and login with the below details:
- User Name: admin
- Password: YOURPASSWORD
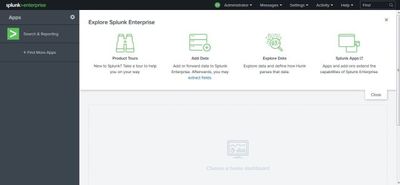
Once you login, you can see follow screen.
JOIN Splunk Training . For more Details Click Splunk Online Training
Install the Splunk Forwarder
The Splunk Universal Forwarder is a small, lightweight daemon which forwards data to your main Splunk server from a variety of sources.
Download the Splunk Universal Forwarder .deb file from the Splunk website:
Once you agree the agreement, then it will download to your local machine. Once it downloaded, Upload the file to your Ubuntu server and place it a temporary directory.
Run the dpkg command to install the Splunk server. The file name of the .deb file may change as new versions are made available so make sure that you have downloaded.
# dpkg -i splunkforwarder-7.1.1-8f0ead9ec3db-linux-2.6-amd64.deb
Selecting previously unselected package splunkforwarder.
(Reading database ... 65803 files and directories currently installed.)
Preparing to unpack splunkforwarder-7.1.1-8f0ead9ec3db-linux-2.6-amd64.deb ...
Unpacking splunkforwarder (7.1.1) ...
Setting up splunkforwarder (7.1.1) ...
complete
Let’s create the init.d script to start the log forwarder.
# cd /opt/splunkforwarder/bin/
# ./splunk enable boot-start
Press SPACE to view all of the license agreement and then Y to accept it.
You can now start the forwarder daemon using the init.d script.
# /etc/init.d/splunk start
For now, we have setup the splunk and splunk forwarder. In next post will see how to parse the logs to splunk.
Enable Receiving input on the Index Server
CLI:
# /opt/splunk/bin/splunk enable listen 9997
Where 9997 (default) is the receiving port for Splunk Forwarder connections
GUI:
Configure the Splunk Index Server to receive data, either in the manager: Settings -> Forwarding and receiving -> configure receiving -> new or via the CLI:
Configure Forwarder connection to Index Server:
CLI:
# /opt/splunkforwarder/bin/splunk add forward-server hostname_or_IP:9997 –auth admin:PASSWORD
(where hostname.domain is the fully qualified address or IP of the index server
GUI:
Settings -> Forwarding and receiving -> configure receiving -> new. Add 9997
Add Data:
CLI:
# /opt/splunkforwarder/bin/splunk add monitor /path/to/app/logs/ -index main -sourcetype %app%
Where /path/to/app/logs/ is the path to application logs on the host that you want to bring into Splunk, and %app% is the name you want to associate with that type of data This will create a file: inputs.conf in /opt/splunkforwarder/etc/apps/search/local/ — here is some documentation on inputs.conf: http://docs.splunk.com/Documentation/Splunk/latest/admin/Inputsconf Note: System logs in /var/log/ are covered in the configuration part of Step 7. If you have application logs in /var/log/*/
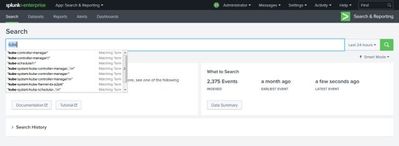
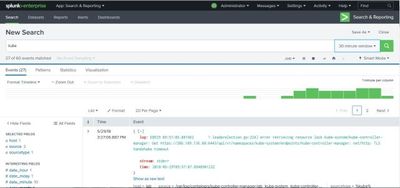
Once you added the monitor successfully, you can login to your dashboard and start search the log and index you mentioned on the last command kube..
- Mark as New
- Bookmark Message
- Subscribe to Message
- Mute Message
- Subscribe to RSS Feed
- Permalink
- Report Inappropriate Content
Hi Gnanasekar,
where ever blacklist can be used, it can be replaced with whitelist(vice versa is true as well)
maybe, if you give us the config file, we can suggest how to do this.
for example - assume there are two host names ABC.company.com and DEF.company.com
[serverClass:all_apps_inputs]
restartSplunkd = true
blacklist.0 = splunk_indexers
whitelist.0 = ABC*
[serverClass:all_apps_inputs]
restartSplunkd = true
blacklist.0 = splunk_indexers
blacklist.1 = DEF*
Sekar
PS - If this or any post helped you in any way, pls consider upvoting, thanks for reading !


