- Splunk Answers
- :
- Splunk Administration
- :
- Getting Data In
- :
- Re: how to create a live up or down Dahboard view
- Subscribe to RSS Feed
- Mark Topic as New
- Mark Topic as Read
- Float this Topic for Current User
- Bookmark Topic
- Subscribe to Topic
- Mute Topic
- Printer Friendly Page
- Mark as New
- Bookmark Message
- Subscribe to Message
- Mute Message
- Subscribe to RSS Feed
- Permalink
- Report Inappropriate Content
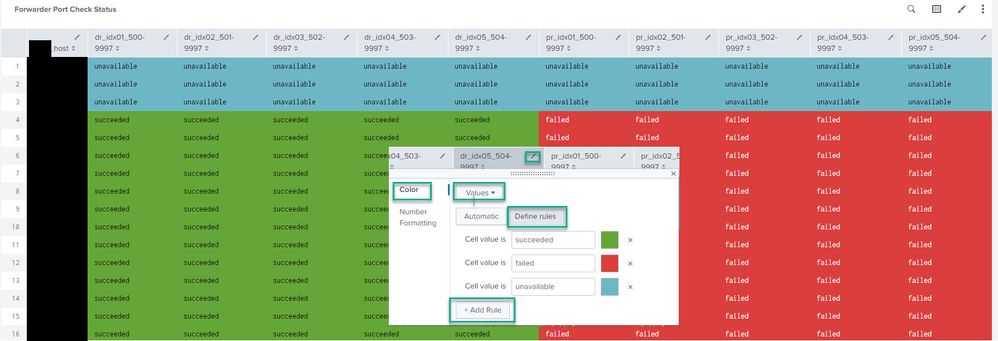
Good day is it possible to get above visualization on Splunk? im kinda new and lost, I designed this myself using PowerPoint. We want to get a view of all the services running in our servers to be like the above image on Splunk dashboards. We are currently running a cron script on our server and forwarding the results to our Splunk server every 5 minutes.
The results look like the above screenshot. We want a live view of all the services running with green being up and red being down.
- Mark as New
- Bookmark Message
- Subscribe to Message
- Mute Message
- Subscribe to RSS Feed
- Permalink
- Report Inappropriate Content
Ok, I would first start with verifying that either the "RUNNING"/"NOT RUNNING" values (I'm assuming there is an inverse value to RUNNING) are recognized by Splunk as a field. You can check apps.splunk.com to see if there is an addon that will parse your sourcetype into key/value pairs or you may have to write regex to capture the value of the run state into a field. Once it's in a field you can run statistic commands against that field such as | top state by host
example inline regex command to extract the state
| rex "(?<state>(RUNNING|DOWN))"
If you are getting overwhelmed, you may want to start with one of the free classes which will cover fields in Splunk https://www.splunk.com/en_us/training/free-courses/splunk-fundamentals-1.html
I also noticed you are running a script from crontab. You could modify the format of your log to log in key-pair values. i.e. process_status="RUNNING" or process_status="UP" or process_status="DOWN" etc.
When Splunk encounters key/pair values it will auto extract fields which should make this task much simpler.
https://dev.splunk.com/enterprise/docs/developapps/logging/loggingbestpractices/
- Mark as New
- Bookmark Message
- Subscribe to Message
- Mute Message
- Subscribe to RSS Feed
- Permalink
- Report Inappropriate Content
- Mark as New
- Bookmark Message
- Subscribe to Message
- Mute Message
- Subscribe to RSS Feed
- Permalink
- Report Inappropriate Content
@bandit thank you sir, what do I add to my base query? all the services? separated by OR ?
- Mark as New
- Bookmark Message
- Subscribe to Message
- Mute Message
- Subscribe to RSS Feed
- Permalink
- Report Inappropriate Content
I'm not familiar with your specific dataset, however you would want to come up with a base query that matches the events in Splunk that have the states you are trying to track.
i.e.
index=myindex sourcetype=mysourcetype host IN (host1,host2,host3) service IN (service1,service2,service3)
note: you can wildcard parts of the host or service filters with * as well. If wanting all hosts and services, you probably don't need to add a host or service constraint.
- Mark as New
- Bookmark Message
- Subscribe to Message
- Mute Message
- Subscribe to RSS Feed
- Permalink
- Report Inappropriate Content
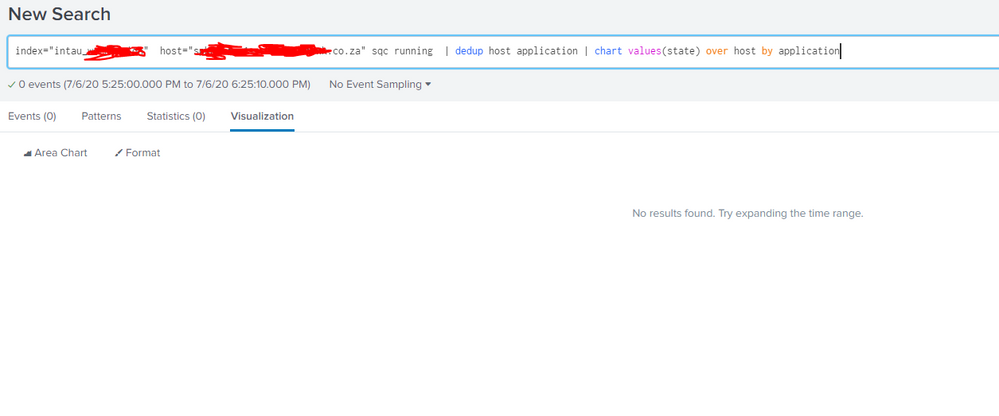
@bandit typing your solution
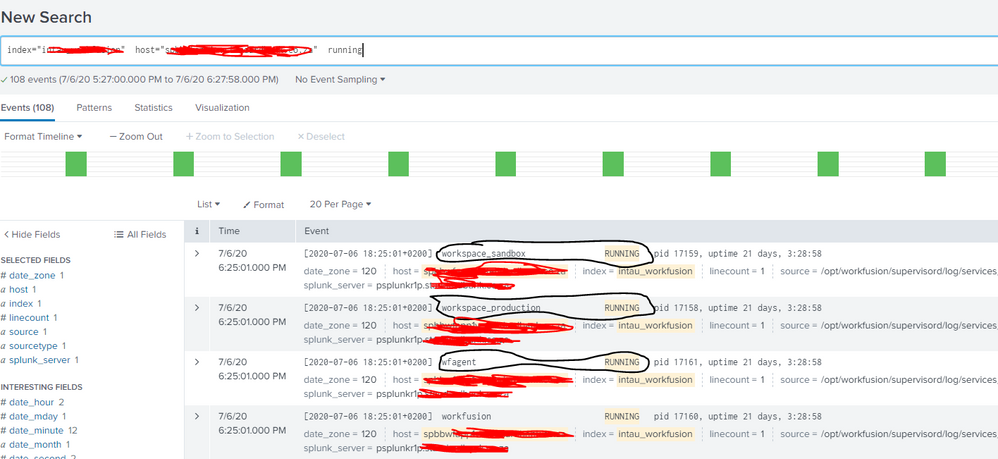
heres what my data looks like, circled in black is what i could use to get the up status, sorry for this but the documentation is also not helping
- Mark as New
- Bookmark Message
- Subscribe to Message
- Mute Message
- Subscribe to RSS Feed
- Permalink
- Report Inappropriate Content
Ok, I would first start with verifying that either the "RUNNING"/"NOT RUNNING" values (I'm assuming there is an inverse value to RUNNING) are recognized by Splunk as a field. You can check apps.splunk.com to see if there is an addon that will parse your sourcetype into key/value pairs or you may have to write regex to capture the value of the run state into a field. Once it's in a field you can run statistic commands against that field such as | top state by host
example inline regex command to extract the state
| rex "(?<state>(RUNNING|DOWN))"
If you are getting overwhelmed, you may want to start with one of the free classes which will cover fields in Splunk https://www.splunk.com/en_us/training/free-courses/splunk-fundamentals-1.html
I also noticed you are running a script from crontab. You could modify the format of your log to log in key-pair values. i.e. process_status="RUNNING" or process_status="UP" or process_status="DOWN" etc.
When Splunk encounters key/pair values it will auto extract fields which should make this task much simpler.
https://dev.splunk.com/enterprise/docs/developapps/logging/loggingbestpractices/


