Join the Conversation
- Find Answers
- :
- Splunk Administration
- :
- Getting Data In
- :
- How can we find out where the delay in indexing is...
- Subscribe to RSS Feed
- Mark Topic as New
- Mark Topic as Read
- Float this Topic for Current User
- Bookmark Topic
- Subscribe to Topic
- Mute Topic
- Printer Friendly Page
- Mark as New
- Bookmark Message
- Subscribe to Message
- Mute Message
- Subscribe to RSS Feed
- Permalink
- Report Inappropriate Content
How can we find out where the delay in indexing is?
We have the following search -
base search
| eval diff= _indextime - _time
| eval capturetime=strftime(_time,"%Y-%m-%d %H:%M:%S")
| eval indextime=strftime(_indextime,"%Y-%m-%d %H:%M:%S")
| table capturetime indextime  diff
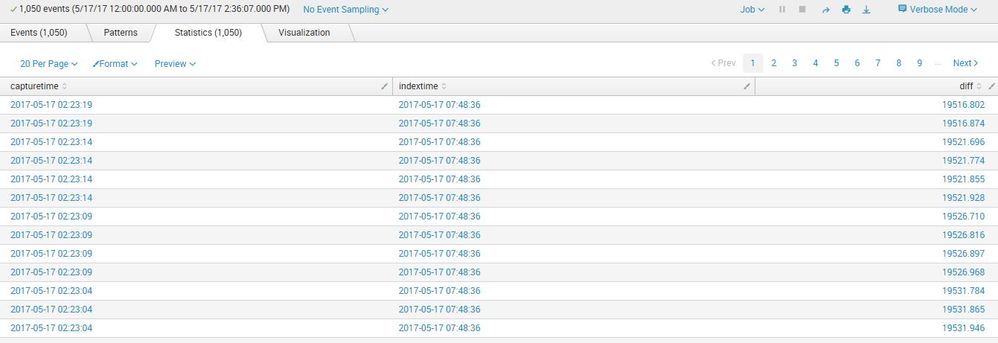
We see the following -
So, we see a delay of over five hours in indexing. Is there a way to find out where these events "got stuck"? In this case, these events are coming from hadoop servers and the forwarder processes around 1/2 million files. We would like to know whether the delay is at the forwarder level or on the indexer side.
- Mark as New
- Bookmark Message
- Subscribe to Message
- Mute Message
- Subscribe to RSS Feed
- Permalink
- Report Inappropriate Content
Hi @rdagan,
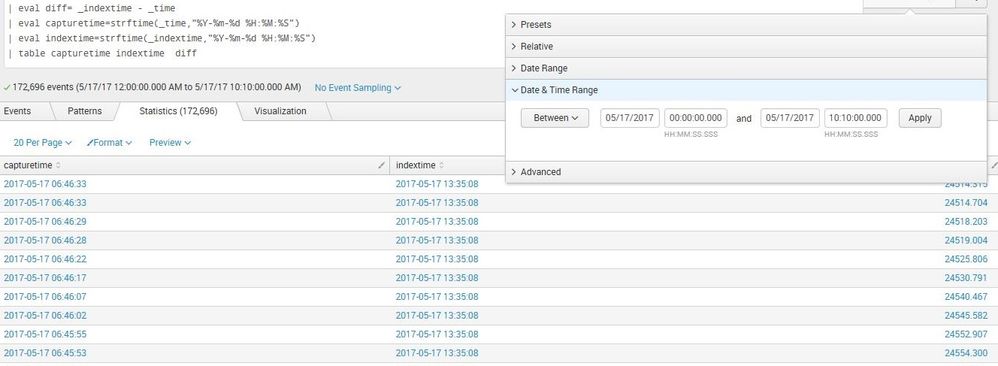
We had a production change on Wednesday night. On the following day, Thursday, we saw this delay in indexing -
base query
followed by -
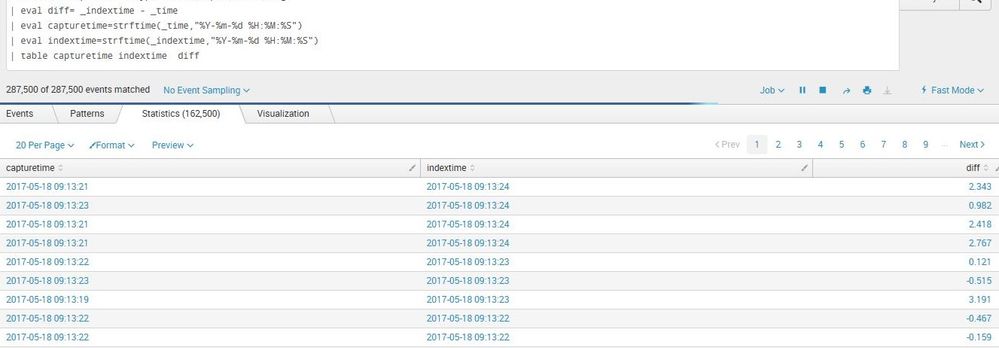
On Friday there was no delay (the right column) -
And we saw this behavior before on other production changes involving this large hadoop file systems. So, I think that it takes the forwarder hours to scan this large number of files and index the right information, a day or two later all is fine. Just checked it now and it's perfect. So, the delay's time frame is around the forwarder bounce time.
The thing is - what can we improve on the forwarder to lower this delay after the bounce?
On the forwarder we see -
$ ulimit -a
core file size          (blocks, -c) 0
data seg size           (kbytes, -d) unlimited
scheduling priority             (-e) 0
file size               (blocks, -f) unlimited
pending signals                 (-i) 1033069
max locked memory       (kbytes, -l) 64
max memory size         (kbytes, -m) unlimited
open files                      (-n) 64000
pipe size            (512 bytes, -p) 8
POSIX message queues     (bytes, -q) 819200
real-time priority              (-r) 0
stack size              (kbytes, -s) 10240
cpu time               (seconds, -t) unlimited
max user processes              (-u) 1024
virtual memory          (kbytes, -v) unlimited
file locks                      (-x) unlimited
And thank you @MuS and @somesoni2 for validating that nothing is fundamentally wrong with either the forwarder's configuration or the index queues...
- Mark as New
- Bookmark Message
- Subscribe to Message
- Mute Message
- Subscribe to RSS Feed
- Permalink
- Report Inappropriate Content
Do you see any helpful information in this Management Console dashboard?
Indexing Pipeline: http://docs.splunk.com/Documentation/Splunk/6.6.0/DMC/IndexingInstance
Forwarders: http://docs.splunk.com/Documentation/Splunk/6.6.0/DMC/ForwardersDeployment
- Mark as New
- Bookmark Message
- Subscribe to Message
- Mute Message
- Subscribe to RSS Feed
- Permalink
- Report Inappropriate Content
Just to clarify, did you check there is no maxKBps = <some Number other than 0> option set in limits.conf on the UF?
- Mark as New
- Bookmark Message
- Subscribe to Message
- Mute Message
- Subscribe to RSS Feed
- Permalink
- Report Inappropriate Content
ok, I see -
$ find . -name "limits.conf"       | xargs grep -i maxKBps
./etc/apps/universal_config_forwarder/local/limits.conf:maxKBps = 0
./etc/apps/SplunkUniversalForwarder/default/limits.conf:maxKBps = 256
./etc/system/default/limits.conf:maxKBps = 0
- Mark as New
- Bookmark Message
- Subscribe to Message
- Mute Message
- Subscribe to RSS Feed
- Permalink
- Report Inappropriate Content
use this command to show what is actually applied as config:
splunk btool limits list thruput
that is on the forwarder. But by looks of it, you have no limit active ... Did you check DMC / MC for any blocked queues?
- Mark as New
- Bookmark Message
- Subscribe to Message
- Mute Message
- Subscribe to RSS Feed
- Permalink
- Report Inappropriate Content
Great. It shows -
$ ./splunk btool limits list thruput
[thruput]
maxKBps = 0
- Mark as New
- Bookmark Message
- Subscribe to Message
- Mute Message
- Subscribe to RSS Feed
- Permalink
- Report Inappropriate Content
I would run a btool command to check which setting is applied. (system/default has lowest priority).
bin/splunk btool limits list --debug | grep maxKBps
- Mark as New
- Bookmark Message
- Subscribe to Message
- Mute Message
- Subscribe to RSS Feed
- Permalink
- Report Inappropriate Content
right - that's what I did...
- Mark as New
- Bookmark Message
- Subscribe to Message
- Mute Message
- Subscribe to RSS Feed
- Permalink
- Report Inappropriate Content
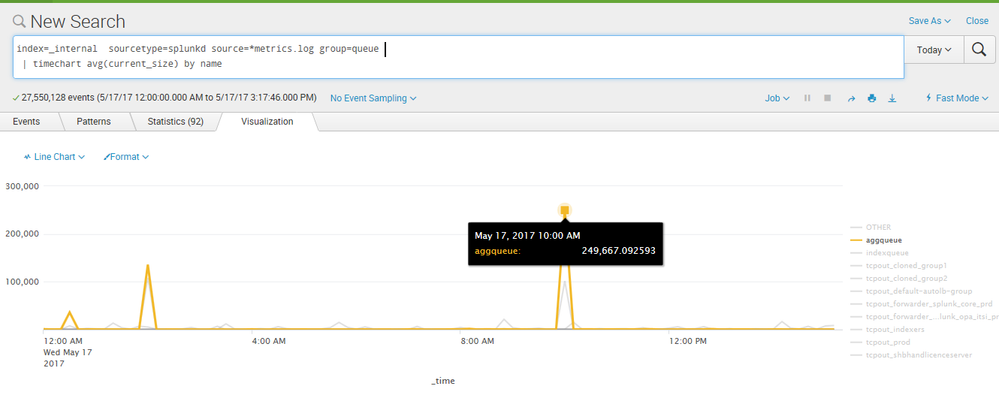
I was late/early on that. Check the various queue sizes if there is any high spikes on the queue sizes.
index=_internal sourcetype=splunkd source=*metrics.log group=queue
| timechart avg(current_size) by name
You can add host=yourUFName to see queue sizes on UF and host=Indexer (add more OR condition for all indexers) to see queue sizes on Indexers. You may need to adjust queue sizes based on results from there. https://answers.splunk.com/answers/38218/universal-forwarder-parsingqueue-kb-size.html
- Mark as New
- Bookmark Message
- Subscribe to Message
- Mute Message
- Subscribe to RSS Feed
- Permalink
- Report Inappropriate Content
- Mark as New
- Bookmark Message
- Subscribe to Message
- Mute Message
- Subscribe to RSS Feed
- Permalink
- Report Inappropriate Content
The aggQueue is where date parsing and line merging happens. This suggest that there may be in-efficient event parsing configuration setup. What is the sourcetype definition (props.conf on indexers) you've for sourcetypes involved?
- Mark as New
- Bookmark Message
- Subscribe to Message
- Mute Message
- Subscribe to RSS Feed
- Permalink
- Report Inappropriate Content
- Mark as New
- Bookmark Message
- Subscribe to Message
- Mute Message
- Subscribe to RSS Feed
- Permalink
- Report Inappropriate Content
Interesting - this sourcetype doesn't show up in in props.conf...
- Mark as New
- Bookmark Message
- Subscribe to Message
- Mute Message
- Subscribe to RSS Feed
- Permalink
- Report Inappropriate Content
It means there is no config setup and Splunk has to figure everything out, hence the spikes. I would suggest defining an efficient line breaking and event parsing for this data and get it deployed on Indexers (would need to restart indexers). I hope you'd see lower latency/queue sizes after that. If you could share some sample raw events, we can suggest some.
- Mark as New
- Bookmark Message
- Subscribe to Message
- Mute Message
- Subscribe to RSS Feed
- Permalink
- Report Inappropriate Content
perfect - I'll work on it.
- Mark as New
- Bookmark Message
- Subscribe to Message
- Mute Message
- Subscribe to RSS Feed
- Permalink
- Report Inappropriate Content
and then -
$ ./splunk btool --debug limits list | grep maxKBp
/opt/splunk/splunkforwarder/etc/apps/universal_config_forwarder/local/limits.conf maxKBps = 0


