- Find Answers
- :
- Splunk Administration
- :
- Getting Data In
- :
- Diagrams of how indexing works in the Splunk platf...
- Subscribe to RSS Feed
- Mark Topic as New
- Mark Topic as Read
- Float this Topic for Current User
- Bookmark Topic
- Subscribe to Topic
- Mute Topic
- Printer Friendly Page
- Mark as New
- Bookmark Message
- Subscribe to Message
- Mute Message
- Subscribe to RSS Feed
- Permalink
- Report Inappropriate Content
The purpose of this topic is to create a home for legacy diagrams on how indexing works in Splunk, created by the legendary Splunk Support Engineer, Masa! Keep in mind the information and diagrams in this topic have not been updated since Splunk Enterprise 7.2. These used to live on an old Splunk community Wiki resource page that has been or will be taken down in the future, but many users have expressed that these have been and still are helpful.
Happy learning!
- Mark as New
- Bookmark Message
- Subscribe to Message
- Mute Message
- Subscribe to RSS Feed
- Permalink
- Report Inappropriate Content
When we think about log events life cycle in Splunk, we can think about how to collect data (Input stage), then processes to parse data and ingest them to Splunk Database (Indexing stage), then, how to keep data in database (hot->Warm->Cold->Freezing). In Splunk Docs or presentations, Input and Indexing stages are often explained as a topic of Getting Data In.
Splunk processes data through pipelines. A pipeline is a thread, and each pipeline consists of multiple functions called processors. There is a queue between pipelines. With these pipelines and queues, index time event processing is parallelized.
This flow chart information is helpful to understand which configuration should be done in which process stage (input, parsing, routing/filtering or indexing). Also, for troubleshooting, it is helpful to understand which processors or queues would be influenced when a queue is filling up or when a processor's CPU time is huge.
Some definitions to start…
- Pipeline: A thread. Splunk creates a thread for each pipeline. Multiple pipelines run in parallel.
- Processor: Processes in pipeline
- Queue: Memory space to store data between pipelines
What Pipelines do...
- Input: Inputs data from source. Source-wide keys, such as source/sourcetypes/hosts, are annotated here. The output of these pipelines are sent to the parsingQueue.
- Parsing: Parsing of UTF8 decoding, Line Breaking, and header is done here. This is the first place to split data stream into a single line event. Note that in a Universal Forwarder (UF), this parsing pipeline does "NOT" do parsing jobs.
- Merging: Line Merging for multi-line events and Time Extraction for each event are done here.
- Typing: Regex Replacement, Punct. Extractions are done here.
- IndexPipe: Tcpout to another Splunk, syslog output, and indexing are done here. In addition, this pipeline is responsible for bytequota, block signing, and indexing metrics such as thruput etc.
Main queues and processors for indexing events
[inputs]
-> parsingQueue
-> [utf8 processor, line breaker, header parsing]
-> aggQueue
-> [date parsing and line merging]
-> typingQueue
-> [regex replacement, punct:: addition]
-> indexQueue
-> [tcp output, syslog output, http output, block signing, indexing, indexing metrics]
-> Disk
*NullQueue could be connected from any queueoutput processor by configuration of outputs.conf
Data in Splunk moves through the data pipeline in phases. Input data originates from inputs such as files and network feeds. As it moves through the pipeline, processors transform the data into searchable events that encapsulate knowledge.
The following figure shows how input data traverses event-processing pipelines (which are the containers for processors) at index-time. Upstream from each processor is a queue for data to be processed.
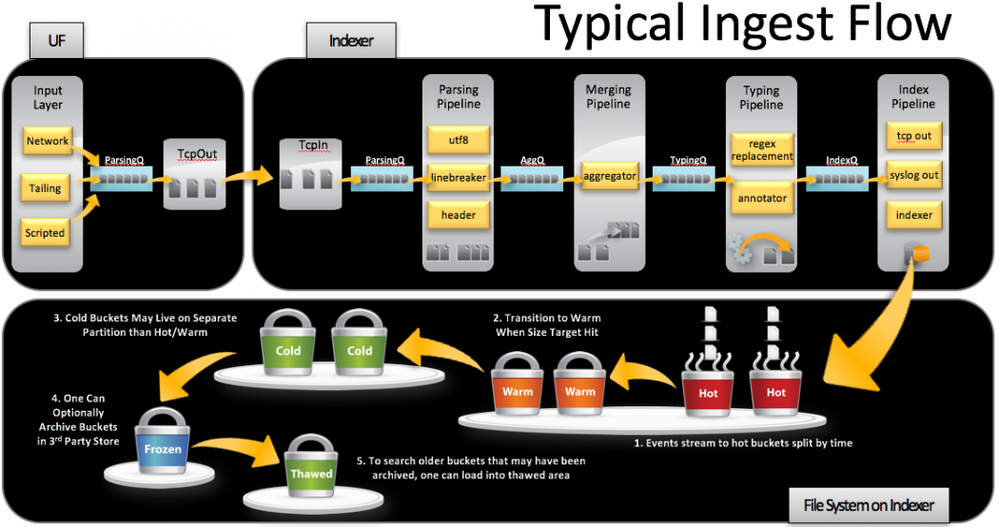
The next figure is a different version of how input data traverses pipelines with buckets life-cycle concepts. It shows the concept of hot buckets, warm buckets, cold buckets and freezing buckets. How data are stored in buckets and indexes is another good topic you should learn.
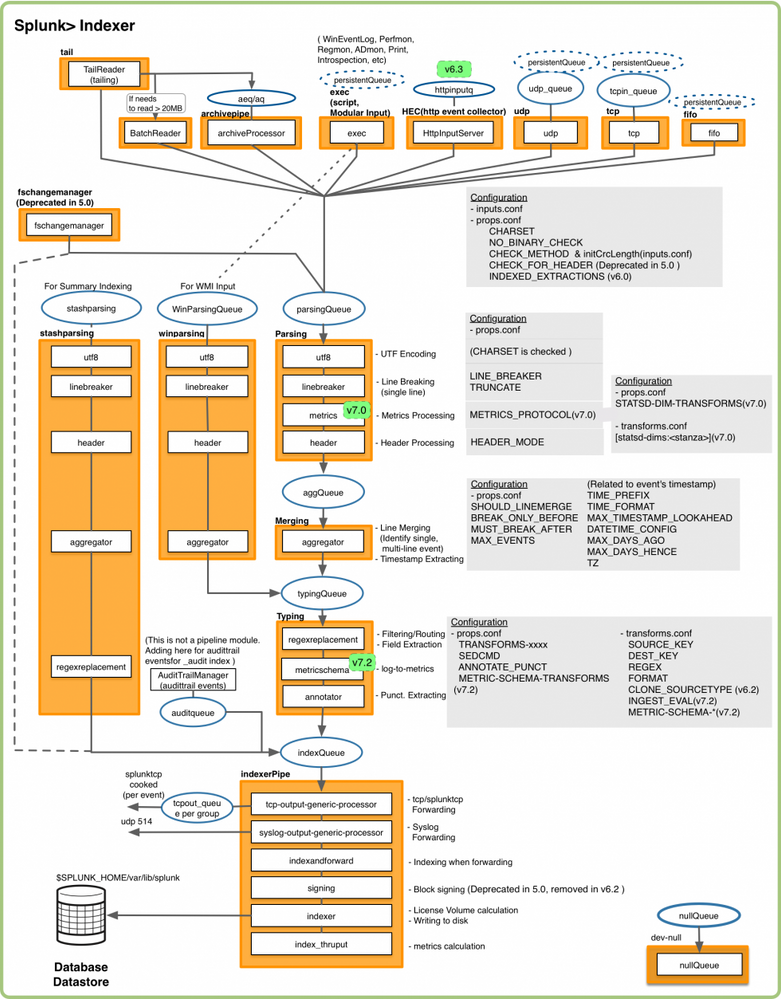
Detail Diagram - Standalone Splunk
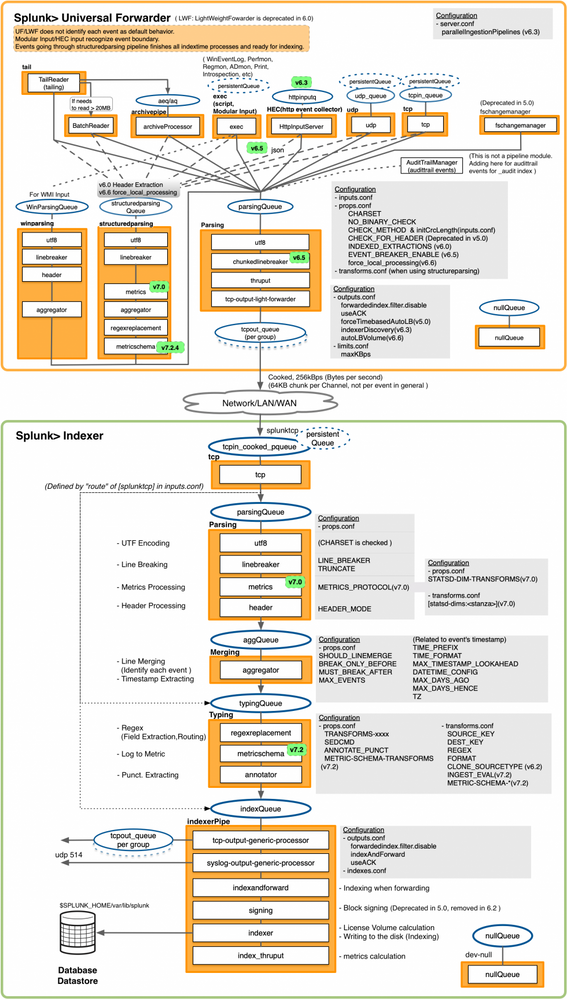
Detail Diagram - Universal Forwarder to Indexer


