- Find Answers
- :
- Splunk Administration
- :
- Deployment Architecture
- :
- "Master Dashboard" in a clustered instance shows o...
- Subscribe to RSS Feed
- Mark Topic as New
- Mark Topic as Read
- Float this Topic for Current User
- Bookmark Topic
- Subscribe to Topic
- Mute Topic
- Printer Friendly Page
- Mark as New
- Bookmark Message
- Subscribe to Message
- Mute Message
- Subscribe to RSS Feed
- Permalink
- Report Inappropriate Content
"Master Dashboard" in a clustered instance shows only "Clustering: Search Head"
Either my instance is misconfigured - or the documentation has an error... or both?
Per "Access the master dashboard":
The master dashboard contains these sections:
- Cluster overview
- Peers tab
- Indexes tab
- Search Heads tab
Also, same source:
Use the monitoring console to view status
You can use the monitoring console to monitor most aspects of your deployment, including the status of your indexer cluster. The information available through the console duplicates much of the information available on the master dashboard.
Note how it says "you can use..." (not "you must"), and that the console's info is supposed to duplicate much of what's on the master dashboard.
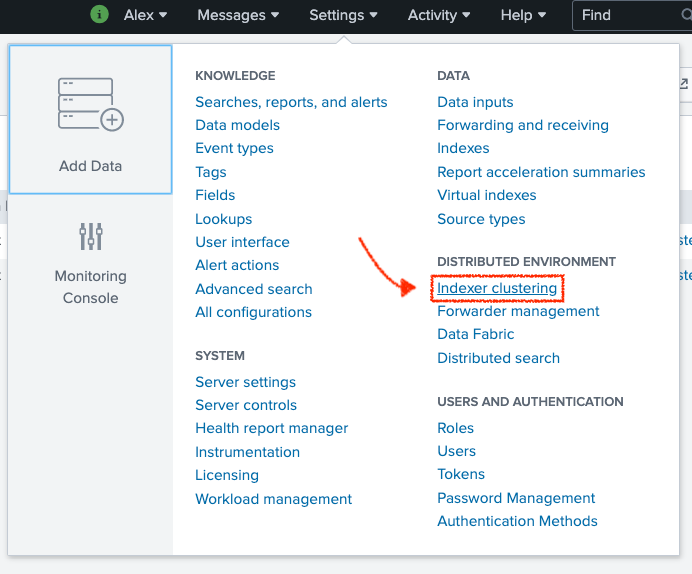
Not the case in my instance - "Master Dashboard" ( Settings - Distributed Environment - Indexer Clustering) is only showing "Clustering: Search Head":
What am I doing wrong?
P.S. Out topology is two sites, three clustered indexers per site, one search head and master node per site.
P.P.S. Navigating to Indexing - Indexer Clustering in Splunk Monitoring Console does show what "Access the master dashboard" says it's supposed to show. If that's intended, the questions are:
- should "Access the master dashboard" article say that when there is a "Monitoring Console", their instructions don't apply? (It does say I could use the Monitoring Console, but does not say I must...)
- shouldn't the "Master Dashboard" in the main instance (not the Monitoring Console) refer me to the Monitoring Console for "indexer clustering"?
Thanks!


