- Find Answers
- :
- Splunk Administration
- :
- Deployment Architecture
- :
- How can we detect excessive overlapping alerts?
- Subscribe to RSS Feed
- Mark Topic as New
- Mark Topic as Read
- Float this Topic for Current User
- Bookmark Topic
- Subscribe to Topic
- Mute Topic
- Printer Friendly Page
- Mark as New
- Bookmark Message
- Subscribe to Message
- Mute Message
- Subscribe to RSS Feed
- Permalink
- Report Inappropriate Content
We reach situations in which application teams set their alerts at the top of the hour and when we (the Splunk team) catch it, it might be too late.
Is there a way to produce a report which lists the run times and detect excessive usage times?
- Mark as New
- Bookmark Message
- Subscribe to Message
- Mute Message
- Subscribe to RSS Feed
- Permalink
- Report Inappropriate Content
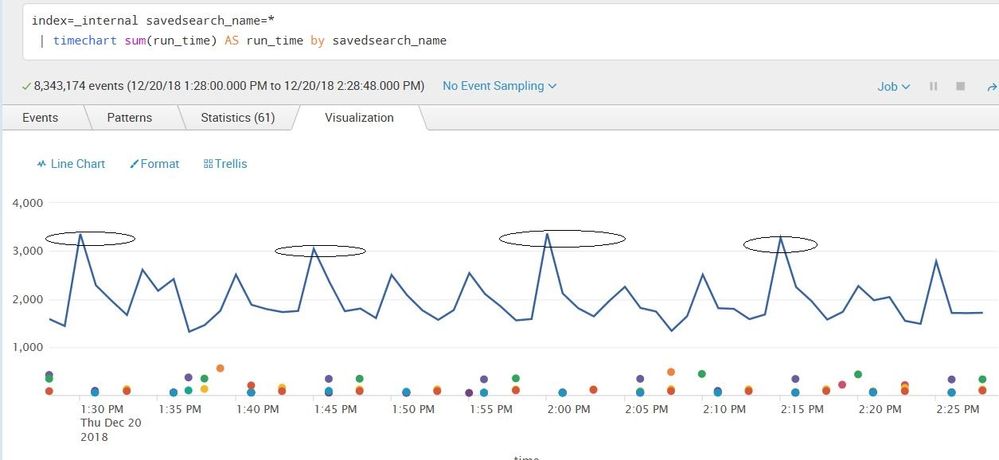
Yeah, you can use the internal index for this. You should explicitly add savedsearch_name for this
index=_internal savedsearch_name=*
| timechart max(run_time) AS run_time by savedsearch_name
- Mark as New
- Bookmark Message
- Subscribe to Message
- Mute Message
- Subscribe to RSS Feed
- Permalink
- Report Inappropriate Content
- Mark as New
- Bookmark Message
- Subscribe to Message
- Mute Message
- Subscribe to RSS Feed
- Permalink
- Report Inappropriate Content
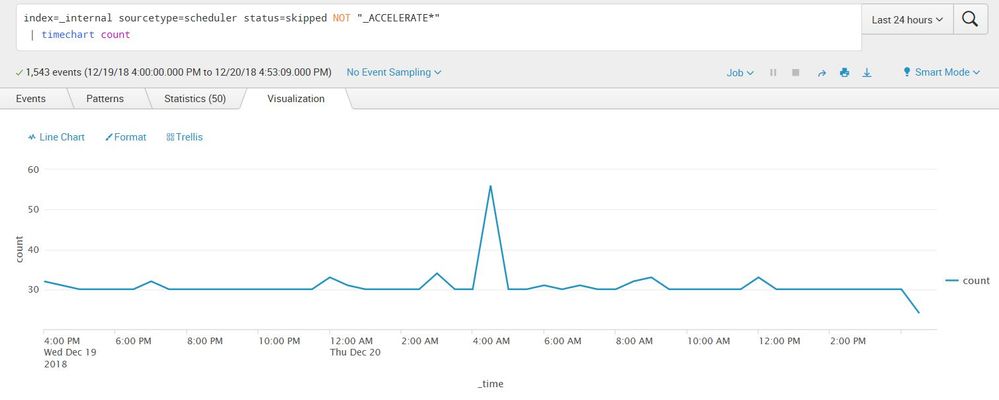
Yes, you sure can!
index=_internal sourcetype=scheduled status=skipped NOT "_ACCELERATE*"
| timechart count by savedsearch_name
- Mark as New
- Bookmark Message
- Subscribe to Message
- Mute Message
- Subscribe to RSS Feed
- Permalink
- Report Inappropriate Content
- Mark as New
- Bookmark Message
- Subscribe to Message
- Mute Message
- Subscribe to RSS Feed
- Permalink
- Report Inappropriate Content
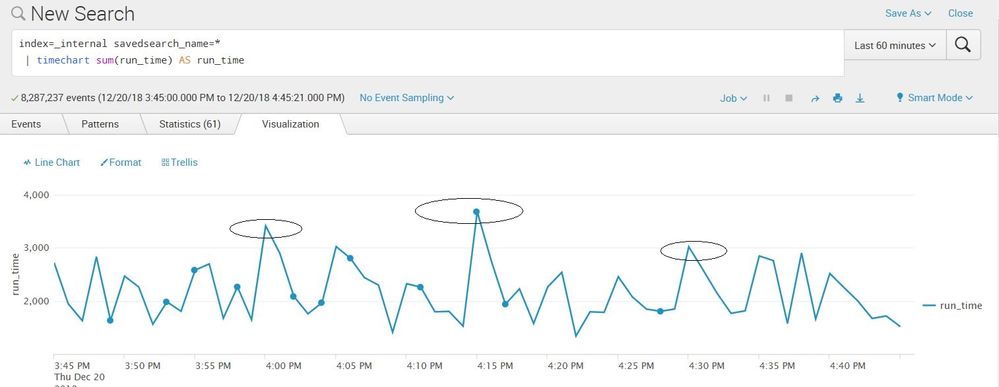
The totals for an hour are -
- Mark as New
- Bookmark Message
- Subscribe to Message
- Mute Message
- Subscribe to RSS Feed
- Permalink
- Report Inappropriate Content
Yeah, you have a problem with skips at 4am. You should trend this over time by using timewrap to see if there's a pattern. Most likely, other searches are competing for resources and they run long and cause skips. You can fix this by changing search priroty away from 0 to auto.
You can split by savedsearch_name or get a total over a span of time by adding span=1h. We use this search to alert us and cut a ticket when we start skipping. Skips are unacceptable for us
- Mark as New
- Bookmark Message
- Subscribe to Message
- Mute Message
- Subscribe to RSS Feed
- Permalink
- Report Inappropriate Content
Much appreciated @skoelpin.


