Join the Conversation
- Find Answers
- :
- Splunk Administration
- :
- Deployment Architecture
- :
- Forwarder suddenly stopped forwarding
- Subscribe to RSS Feed
- Mark Topic as New
- Mark Topic as Read
- Float this Topic for Current User
- Bookmark Topic
- Subscribe to Topic
- Mute Topic
- Printer Friendly Page
- Mark as New
- Bookmark Message
- Subscribe to Message
- Mute Message
- Subscribe to RSS Feed
- Permalink
- Report Inappropriate Content
Forwarder suddenly stopped forwarding
Hi,
I configured a universal forwarder to send data to 4 indexers. It was working alright until it stopped logging last tuesday at 7.50 am suddenly.
I think there might be three reasons,
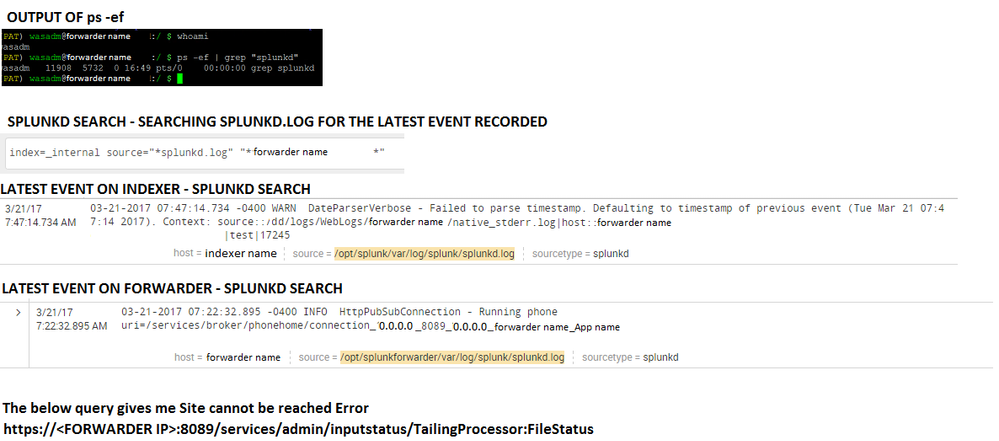
- Splunkd may not running on the forwarder. But I think it is running - Please refer to the output of ps -ef in the screenshot The indexers are definitely up and working for other forwarders
- All the logs on the forwarder stopped
- Some kind of network issue - Please guide me on how to check the connectivity between the indexer and forwarder.
I have also displayed the latest Splunkd log (on the forwarder and the indexers) in the attachment. There is not even internal logs in Splunk post last Tuesday.
Interestingly, the below URL cannot be reached. I do not know if this is significant.
https://Forwarder URL:8089/services/admin/inputstatus/TailingProcessor:FileStatus
Please help me fix this issue.
NOTE: 0.0.0.0 in the attachment indicates the forwarder url.
Thanks,
Deepak
- Mark as New
- Bookmark Message
- Subscribe to Message
- Mute Message
- Subscribe to RSS Feed
- Permalink
- Report Inappropriate Content
HI deepak02,
at first go on Search Head and run index=_internal host=your_host to verify if you receive logs from forwarder, if you have Splunk logs, the problem in in the time parsing of your logs (probably timestamp is wrong) , if instead you don't have logs , there is a connection problem.
So, on forwarder open $SPLUNK_HOME/var/log/splunk/splunkd.log and see if there are connection problems after stop: if connection is OK, you have to verify data parsing configurations (timestamp), if instead there are connection problems, you have to debug them:
Stop forwarding started after a server reboot?
if yes, did you checked iptables?
If this test is ok, verify if there was some change in network rules, so check open ports (telnet from forwarder to indexers on ports 9997 and 8089).
Bye.
Giuseppe
- Mark as New
- Bookmark Message
- Subscribe to Message
- Mute Message
- Subscribe to RSS Feed
- Permalink
- Report Inappropriate Content
Does not look like the forwarder is running
use this to check the status
/opt/splunkforwarder/bin/splunk status
and you can use this to start it
/opt/splunkforwarder/bin/splunk start
This will only work if you have connectivity to the forwarder and if the splunk forwarder service is running. It will also not work out of the box with the default admin password.
https://:8089/services/admin/inputstatus/TailingProcessor:FileStatus
You can run this directly on the forwarder to see the same output
/opt/splunkforwarder/bin/splunk _internal call /services/admin/inputstatus/TailingProcessor:FileStatus
- Mark as New
- Bookmark Message
- Subscribe to Message
- Mute Message
- Subscribe to RSS Feed
- Permalink
- Report Inappropriate Content
Thankyou very much. I will certainly check it.
Just for clarification, does the ps -ef command not mean anything? It gave me a few numbers.
Also, I work for a big organization, so it is likely to be atleast a week before I get access to run the commands. Can I do any other troubleshooting/temporary fix in the meantime?
- Mark as New
- Bookmark Message
- Subscribe to Message
- Mute Message
- Subscribe to RSS Feed
- Permalink
- Report Inappropriate Content
Yes, it seems like its not running
you should see something like
[splunkd pid=9192] splunkd -p 8089 restart [process-runner]
- Mark as New
- Bookmark Message
- Subscribe to Message
- Mute Message
- Subscribe to RSS Feed
- Permalink
- Report Inappropriate Content
Thankyou, what could be the cause? Have you come across this before? Is it a known issue in Splunk? Any reference/links will be highly useful.
- Mark as New
- Bookmark Message
- Subscribe to Message
- Mute Message
- Subscribe to RSS Feed
- Permalink
- Report Inappropriate Content
I dont have enough information to tell you why its not running. Maybe someone stopped the service? Maybe it crashed?
Check /opt/splunkforwarder/var/logs/splunk/splunkd.log on the host for any ERRORs that may have occurred during the time you stopped receiving logs.
Also check /var/log/messages AND OR dmesg to see if there are any OOM or other conditions on the splunkd process.

