- Find Answers
- :
- Splunk Administration
- :
- Deployment Architecture
- :
- Configure Prometheus with Splunk
- Subscribe to RSS Feed
- Mark Topic as New
- Mark Topic as Read
- Float this Topic for Current User
- Bookmark Topic
- Subscribe to Topic
- Mute Topic
- Printer Friendly Page
- Mark as New
- Bookmark Message
- Subscribe to Message
- Mute Message
- Subscribe to RSS Feed
- Permalink
- Report Inappropriate Content
Configure Prometheus with Splunk
Hi ,
I am a developer and looking to integrate my Prometheus with splunk
Prometheus is up and running at my local (http://localhost:9090)
Objective is to post metrics data(Hyperledger fabric metrics) from Prometheus directly to splunk for monitoring, instead of Grafana
For grafana i just need to provide the Data source to it ie. (http://localhost:9090)
But i am unable to do the same for splunk
Steps i followed :
1. Created a HTTP event listener (HEC) on splunk.
2. Fetched the Token
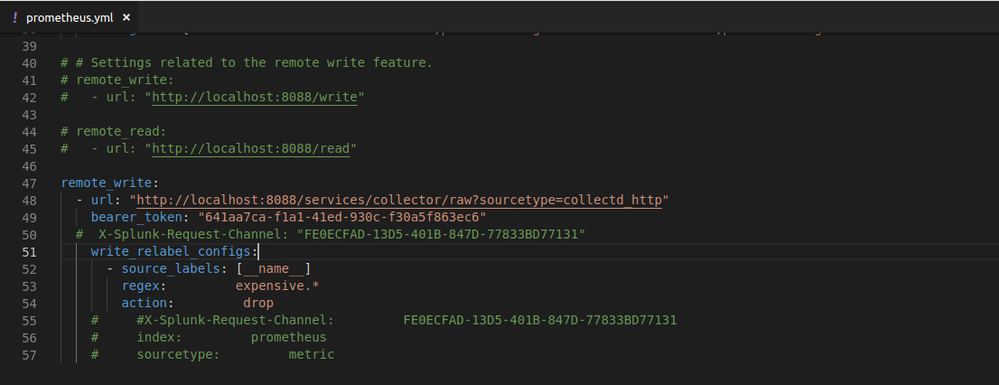
3. Passed the Token and url in Prometheus.yaml

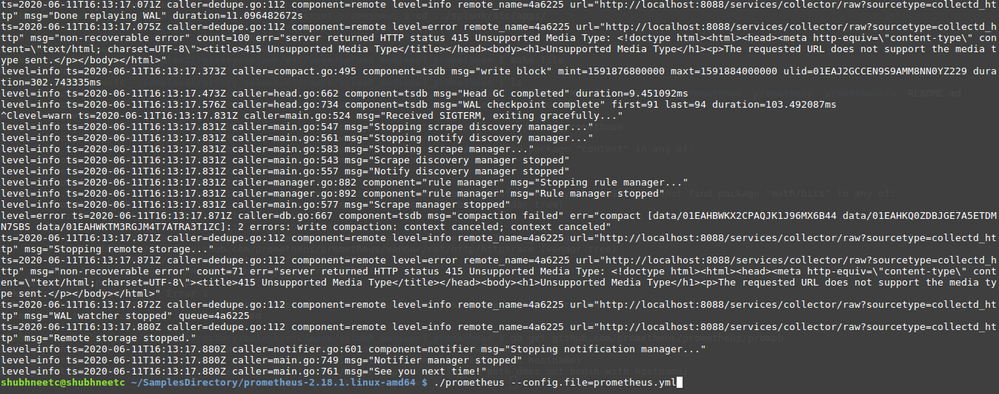
4. When i start the Prometheus container for establishing connection with splunk It gives me below error
Kindly guide me how to post my metrics/ Prometheus URL to splunk such that that i can monitor my metrics
Do let me know if i miss onto any step .
@splunk #Prometheus #metrics #HyperledgerFabricV2.0 #metrics #Hyper-ledger @Anonymous #IBM
- Mark as New
- Bookmark Message
- Subscribe to Message
- Mute Message
- Subscribe to RSS Feed
- Permalink
- Report Inappropriate Content
it looks like you may be trying to run before you can walk.
It looks like you have setup your HEC endpoint, however the first thing I would do is look at trying to send a test message to it from the same box using a script.
The error also indicates it could be to do with the content sent through. Either the message could be too large (fairly common with xml, which this looks like it is) or there's something within. if possible I would look to try and restructure the data sent through to Splunk so the message is easier to work with when inside of Splunk.
- Mark as New
- Bookmark Message
- Subscribe to Message
- Mute Message
- Subscribe to RSS Feed
- Permalink
- Report Inappropriate Content
Can i Connect to you on hangout or something.
Thanks in Advance
- Mark as New
- Bookmark Message
- Subscribe to Message
- Mute Message
- Subscribe to RSS Feed
- Permalink
- Report Inappropriate Content
Sorry I dont think there much else I would be able to assist with. I would suggest that if you need further guidance, to speak to your local account manager and support team who may be able to speak to you in further detail.
Your other option is to reach out to a partner and see what they can offer.
- Mark as New
- Bookmark Message
- Subscribe to Message
- Mute Message
- Subscribe to RSS Feed
- Permalink
- Report Inappropriate Content
Indeed ,
I am very much new to splunk and its processes.
Well yes the Data is quite large and of real time (statsD, metrics, healthz), Though i successfully send data via Curl commands that particular HEC.
It would be good if I could connect to for guidance.
