Turn on suggestions
Auto-suggest helps you quickly narrow down your search results by suggesting possible matches as you type.
Dashboards & Visualizations
×
Join the Conversation
Without signing in, you're just watching from the sidelines. Sign in or Register to connect, share, and be part of the Splunk Community.
Turn on suggestions
Auto-suggest helps you quickly narrow down your search results by suggesting possible matches as you type.
- Find Answers
- :
- Using Splunk
- :
- Dashboards & Visualizations
- :
- post-process search to get a single value?
Options
- Subscribe to RSS Feed
- Mark Topic as New
- Mark Topic as Read
- Float this Topic for Current User
- Bookmark Topic
- Subscribe to Topic
- Mute Topic
- Printer Friendly Page
- Mark as New
- Bookmark Message
- Subscribe to Message
- Mute Message
- Subscribe to RSS Feed
- Permalink
- Report Inappropriate Content
mitag
Contributor
04-24-2020
04:29 PM
This is a follow up to my "simplifying a (field extraction error) dashboard?" question earlier today, and the new question is:
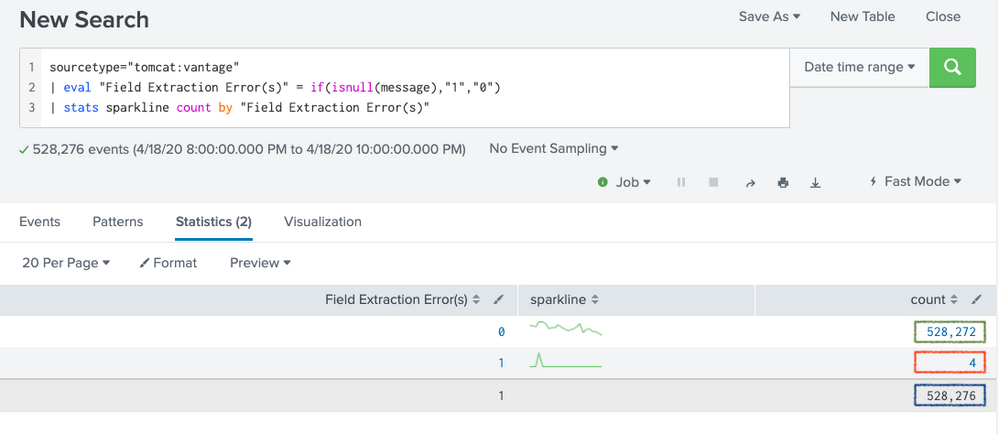
How do I structure my base and post-process searches to produce single value visualizations for the three calculated stats values: (1) count of events with errors, (2) w/o errors, and (3) the total - in addition to this?
sourcetype="tomcat:vantage"
| eval "Field Extraction Error(s)" = if(isnull(message),"1","0")
| stats sparkline count by "Field Extraction Error(s)"
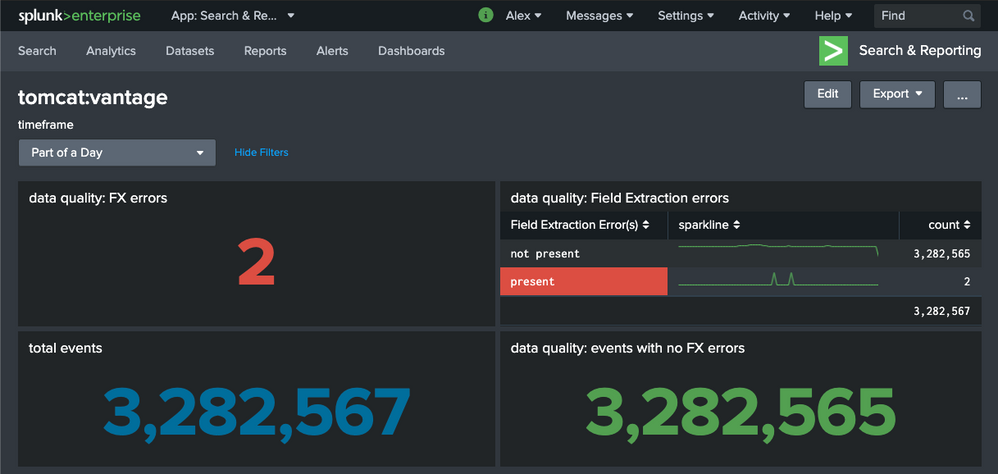
In other words the result should be something like this, where the single value visualizations are produced using base and post-process searches, as opposed to separate ones:
Thanks!
1 Solution
- Mark as New
- Bookmark Message
- Subscribe to Message
- Mute Message
- Subscribe to RSS Feed
- Permalink
- Report Inappropriate Content
to4kawa
Ultra Champion
04-24-2020
06:18 PM
sample(use index=_internal😞
<dashboard>
  <label>Single sample</label>
  <search id="base2">
    <query>index=_internal
 | eval "Field Extraction Error(s)" = if(isnotnull(message),"1","0")
 | stats count sparkline by "Field Extraction Error(s)"
 | addcoltotals labelfield="Field Extraction Error(s)" label=""</query>
    <earliest>-60m@m</earliest>
    <latest>now</latest>
    <sampleRatio>1</sampleRatio>
  </search>
  <row>
    <panel>
      <single>
        <title>data quality: events with no FX Error(s)</title>
        <search base="base2">
          <query>| search "Field Extraction Error(s)" IN ("0")
| table count</query>
        </search>
        <option name="drilldown">none</option>
      </single>
    </panel>
    <panel>
      <table>
        <title>data quality: Field Extraction Error(s)</title>
        <search base="base2">
          <query>| table "Field Extraction Error(s)" sparkline count</query>
        </search>
        <option name="drilldown">none</option>
      </table>
    </panel>
  </row>
  <row>
    <panel>
      <single>
        <title>data quality: FX Error(s)</title>
        <search base="base2">
          <query>| search "Field Extraction Error(s)" IN ("1")
| table count</query>
        </search>
        <option name="drilldown">none</option>
      </single>
    </panel>
    <panel>
      <single>
        <title>data quality: Total</title>
        <search base="base2">
          <query>| search "Field Extraction Error(s)" IN ("")
| table count</query>
        </search>
        <option name="drilldown">none</option>
      </single>
    </panel>
  </row>
</dashboard>
you can do it.
- Mark as New
- Bookmark Message
- Subscribe to Message
- Mute Message
- Subscribe to RSS Feed
- Permalink
- Report Inappropriate Content
mitag
Contributor
04-27-2020
12:58 PM
Thank you - this works, and I learned a couple of things! P.S. A simplified version of your answer:
Base Search:
sourcetype="tomcat:vantage"
  | eval "Field Extraction Error(s)" = if(isnull(message),"Present","Not Present")
  | stats sparkline count by "Field Extraction Error(s)"
  | addcoltotals labelfield="Field Extraction Error(s)" label="Total Events"
Post-process searches:
| search "Field Extraction Error(s)" IN ("Present")
| table count

| table "Field Extraction Error(s)" sparkline count

| search "Field Extraction Error(s)" IN ("Total Events")
| table count

| search "Field Extraction Error(s)" IN ("Not Present")
| table count
Get Updates on the Splunk Community!
.conf25 technical session recap of Observability for Gen AI: Monitoring LLM ...
If you’re unfamiliar, .conf is Splunk’s premier event where the Splunk community, customers, partners, and ...
A Season of Skills: New Splunk Courses to Light Up Your Learning Journey
There’s something special about this time of year—maybe it’s the glow of the holidays, maybe it’s the ...
Announcing the Migration of the Splunk Add-on for Microsoft Azure Inputs to ...
Announcing the Migration of the Splunk Add-on for Microsoft Azure Inputs to Officially Supported Splunk ...


