- Find Answers
- :
- Using Splunk
- :
- Dashboards & Visualizations
- :
- dashboard table in html form using seach output
- Subscribe to RSS Feed
- Mark Topic as New
- Mark Topic as Read
- Float this Topic for Current User
- Bookmark Topic
- Subscribe to Topic
- Mute Topic
- Printer Friendly Page
- Mark as New
- Bookmark Message
- Subscribe to Message
- Mute Message
- Subscribe to RSS Feed
- Permalink
- Report Inappropriate Content
Hello,
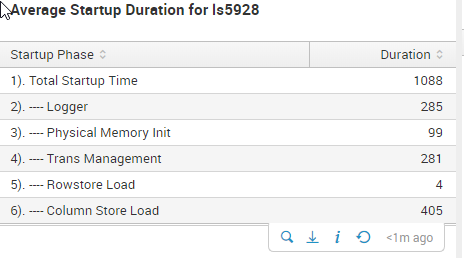
I have following panel in my dashboard, which basically
     <panel id="Averages">
      <table>
        <title>Average Startup Duration for $host$</title>
        <search>
          <query>|inputcsv StartupMinMaxAvg.txt
| where host = "$host$"

| rename avg_total as "1). Total Startup Time" avg_logger as "2). ---- Logger"  avg_pm as "3). ---- Physical Memory Init" avg_transmgmt as "4). ---- Trans Management" avg_rowstore as "5). ---- Rowstore Load" avg_cs_load as "6). ---- Column Store Load"

| table "1). Total Startup Time" "2). ---- Logger" "3). ---- Physical Memory Init" "4). ---- Trans Management" "5). ---- Rowstore Load" "6). ---- Column Store Load"

| transpose
| rename "column" as "Startup Phase", "row 1" as "Duration"</query>
          <earliest>-24h@h</earliest>
          <latest>now</latest>
        </search>
        <option name="drilldown">none</option>
        <option name="refresh.display">progressbar</option>
      </table>
    </panel>
Now, I do not really like the table-viz look itself. It just does not fit to the rest of the panels.
Is it possible to visualize it as a html table, let us say with 25% width, without visible table lines, with bold title?
Or the html tables have to be static and do not accept the output from the search ...
Kind Regards,
Kamil
- Mark as New
- Bookmark Message
- Subscribe to Message
- Mute Message
- Subscribe to RSS Feed
- Permalink
- Report Inappropriate Content
@damucka which version of Splunk are you on. I think either in Splunk 7.0+ or Splunk 7.1+ the table row does not have border. Also table column width can be adjusted by CSS Override which would work similar to how you expect it to work with html table.
Refer to my previous answers for
- Table Column Width: https://answers.splunk.com/answers/636935/column-width-1.html
- Here is a recent answer with example to use JS to construct HTML table: https://answers.splunk.com/answers/809414/issue-with-css-html-js-formatting-search-output.html#answe...
- You can use and JS based table library and integrate your Search Manager with your own Custom Visualization, in your case some JS based table library.
| makeresults | eval message= "Happy Splunking!!!"

