Are you a member of the Splunk Community?
- Find Answers
- :
- Using Splunk
- :
- Dashboards & Visualizations
- :
- Re: bar timeline chart of duration of any signal
- Subscribe to RSS Feed
- Mark Topic as New
- Mark Topic as Read
- Float this Topic for Current User
- Bookmark Topic
- Subscribe to Topic
- Mute Topic
- Printer Friendly Page
- Mark as New
- Bookmark Message
- Subscribe to Message
- Mute Message
- Subscribe to RSS Feed
- Permalink
- Report Inappropriate Content
bar timeline chart of duration of any signal
Hi, here is the data
| delta _time as dlt
| eval dlt=abs(dlt)
| table _time, state, dlt
"_time",state,dlt
"2025-03-21T13:25:33.000+0100","Störung",
"2025-03-21T13:21:46.000+0100",Verteilzeit,"227.000"
"2025-03-21T13:05:01.000+0100","Personal fehlt","1005.000"
"2025-03-21T11:23:35.000+0100","Produktion ON","6086.000"
"2025-03-21T11:23:19.000+0100",Wartung,"16.000"
"2025-03-21T11:21:41.000+0100","Störung","98.000"
"2025-03-21T11:20:04.000+0100","Produktion OFF","97.000"
"2025-03-21T11:19:57.000+0100","Produktion ON","7.000"
"2025-03-21T10:47:01.000+0100","Produktion OFF","1976.000"
"2025-03-21T10:46:55.000+0100","Produktion ON","6.000"
"2025-03-21T10:46:28.000+0100",Verteilzeit,"27.000"
"2025-03-21T10:46:21.000+0100",Verteilzeit,"7.000"
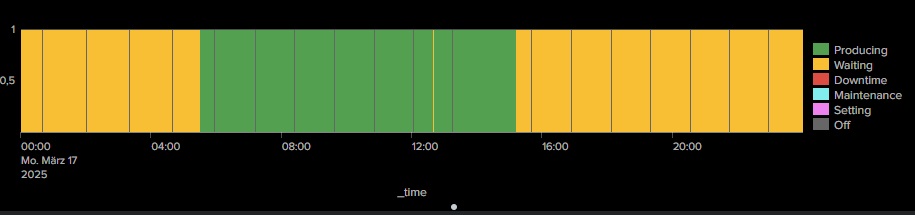
There are 7 different signals. Each (state) is comming from the system as an impuls in specific time stamp and represents the state of any workplace. The interval between these signals is the delta (dlt) or duration of the previous state. There is guaranteed no overlapping.
I would like to visualise a bar chart of this duration on the timeline. E.g. last 24h. See an example (duration.jpg). Each begin of color is in fact timestamp of the state.
If there is any idea, please. This would help me a lot.
- Mark as New
- Bookmark Message
- Subscribe to Message
- Mute Message
- Subscribe to RSS Feed
- Permalink
- Report Inappropriate Content
Hi @spisiakmi
Try adding the following to your search, is this what you are looking for?
| append
    [| gentimes start=-1 increment=1m]
| eval _time=coalesce(starttime, _time)
| sort 0 _time
| filldown state
| eval count=1
| timechart latest(count) by state
Here is the full search I used which loads in some sample data:
| makeresults count=12
| streamstats count as row_number
| eval _time=case(
    row_number==1, strptime("2025-03-23T13:25:33.000+0100", "%Y-%m-%dT%H:%M:%S.%3Q%z"),
    row_number==2, strptime("2025-03-23T13:21:46.000+0100", "%Y-%m-%dT%H:%M:%S.%3Q%z"),
    row_number==3, strptime("2025-03-23T13:05:01.000+0100", "%Y-%m-%dT%H:%M:%S.%3Q%z"),
    row_number==4, strptime("2025-03-23T11:23:35.000+0100", "%Y-%m-%dT%H:%M:%S.%3Q%z"),
    row_number==5, strptime("2025-03-23T11:23:19.000+0100", "%Y-%m-%dT%H:%M:%S.%3Q%z"),
    row_number==6, strptime("2025-03-23T11:21:41.000+0100", "%Y-%m-%dT%H:%M:%S.%3Q%z"),
    row_number==7, strptime("2025-03-23T11:20:04.000+0100", "%Y-%m-%dT%H:%M:%S.%3Q%z"),
    row_number==8, strptime("2025-03-23T11:19:57.000+0100", "%Y-%m-%dT%H:%M:%S.%3Q%z"),
    row_number==9, strptime("2025-03-23T10:47:01.000+0100", "%Y-%m-%dT%H:%M:%S.%3Q%z"),
    row_number==10, strptime("2025-03-23T10:46:55.000+0100", "%Y-%m-%dT%H:%M:%S.%3Q%z"),
    row_number==11, strptime("2025-03-23T10:46:28.000+0100", "%Y-%m-%dT%H:%M:%S.%3Q%z"),
    row_number==12, strptime("2025-03-23T10:46:21.000+0100", "%Y-%m-%dT%H:%M:%S.%3Q%z")
    )
| eval state=case(
    row_number==1, "Störung",
    row_number==2, "Verteilzeit",
    row_number==3, "Personal fehlt",
    row_number==4, "Produktion ON",
    row_number==5, "Wartung",
    row_number==6, "Störung",
    row_number==7, "Produktion OFF",
    row_number==8, "Produktion ON",
    row_number==9, "Produktion OFF",
    row_number==10, "Produktion ON",
    row_number==11, "Verteilzeit",
    row_number==12, "Verteilzeit"
    )
| eval dlt=case(
    row_number==1, null(),
    row_number==2, "227.000",
    row_number==3, "1005.000",
    row_number==4, "6086.000",
    row_number==5, "16.000",
    row_number==6, "98.000",
    row_number==7, "97.000",
    row_number==8, "7.000",
    row_number==9, "1976.000",
    row_number==10, "6.000",
    row_number==11, "27.000",
    row_number==12, "7.000"
    )
| append
    [| gentimes start=-1 increment=1m]
| eval _time=coalesce(starttime, _time)
| sort 0 _time
| filldown state
| eval count=1
| timechart latest(count) by state
Please let me know how you get on and consider adding karma to this or any other answer if it has helped.
Regards
Will
- Mark as New
- Bookmark Message
- Subscribe to Message
- Mute Message
- Subscribe to RSS Feed
- Permalink
- Report Inappropriate Content
Hi Will,
many thanks for you support. I tried your code directly and became this view (Screenshot 2025-03-24 145511.jpg). Not so as your screenshot. And it is not clear for me, where is considered the dlt. As a duration of the state.

🌟 From Audit Chaos to Clarity: Welcoming Audit Trail v2
Splunk New Course Releases for a Changing World
Insights from .conf 2025, Smart Edge Processor Scaling, and a New Splunk Lantern ...
