- Find Answers
- :
- Using Splunk
- :
- Dashboards & Visualizations
- :
- Why am I Receiving "A custom JavaScript error caus...
- Subscribe to RSS Feed
- Mark Topic as New
- Mark Topic as Read
- Float this Topic for Current User
- Bookmark Topic
- Subscribe to Topic
- Mute Topic
- Printer Friendly Page
- Mark as New
- Bookmark Message
- Subscribe to Message
- Mute Message
- Subscribe to RSS Feed
- Permalink
- Report Inappropriate Content
Hello Splunkers,
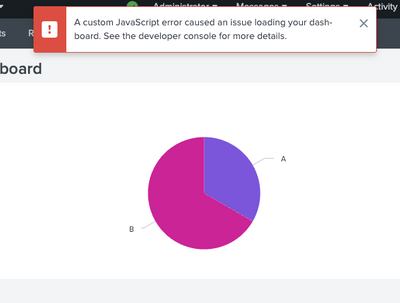
I'm sharing a temporary solution for "A custom JavaScript error caused an issue loading your dashboard" popup message when your dashboard has any console errors.

Basically, this error message indicates that there is some javascript error during the execution of the script and you can easily check by doing inspect as well.
Before applying this solution I suggest identifying the javascript error and resolve in case there is scope. Bcoz it may impact the logic.
If you are trying to resolve this issue and taking time then this temporary solution is good for you 🙂
This is a Javascript-based solution, which overrides the popup container and makes it empty whenever it tries to populate with the error message.
You can put this JS Code in your dashboard's Custom JS file or create the common file and use it in multiple dashboards.
require([
    'underscore',
    'jquery',
    'splunkjs/mvc',
    'splunkjs/mvc/simplexml/ready!'
], function(_, $, mvc) {

    console.log($('[data-test="layer-container"]'));

    $('[data-test="layer-container"]').on('DOMSubtreeModified', function(){
        console.log('changed two');
        $('[data-test="layer-container"]').empty();
    });

    $('[data-test="layer-container"]').empty();
});
I have tried this with Splunk Enterprise Version: 9.0.2 Build: 17e00c557dc1. In case you find any difficulties please let us know.
I hope this will help you.
Happy Splunking
Thanks
KV
If any of my replies help you to solve the problem Or gain knowledge, an upvote would be appreciated.
- Mark as New
- Bookmark Message
- Subscribe to Message
- Mute Message
- Subscribe to RSS Feed
- Permalink
- Report Inappropriate Content
Can you please try this? Now no other code will be impacted.
require([
    'underscore',
    'jquery',
    'splunkjs/mvc',
    'splunkjs/mvc/simplexml/ready!'
], function (_, $, mvc) {
    $('[data-test="layer-container"]').on('DOMSubtreeModified', function () {
        console.log('changed two');
        if ($('[aria-label="Toast messages container"]')) {
            console.log("Toast messages container cleared");
            $('[aria-label="Toast messages container"]').empty();
        }
    });
});
Please check & confirm with your code.
Thanks
KV
If any of my replies help you to solve the problem Or gain knowledge, an upvote would be appreciated.
- Mark as New
- Bookmark Message
- Subscribe to Message
- Mute Message
- Subscribe to RSS Feed
- Permalink
- Report Inappropriate Content
After upgrade 9.2.0. splunk app for AWS got the same error "A custom JavaScript error caused an issue loading your dashboard. See the developer console for more details.".
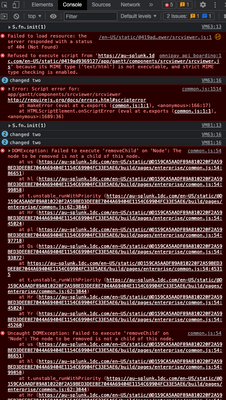
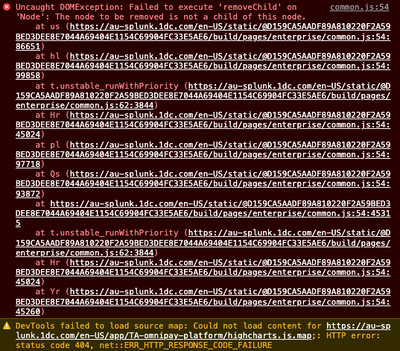
Unable to open dashboard. While seeing the developer console, below error shwoing.
How to bring it back.
- Mark as New
- Bookmark Message
- Subscribe to Message
- Mute Message
- Subscribe to RSS Feed
- Permalink
- Report Inappropriate Content
Can you please try this? Now no other code will be impacted.
require([
    'underscore',
    'jquery',
    'splunkjs/mvc',
    'splunkjs/mvc/simplexml/ready!'
], function (_, $, mvc) {
    $('[data-test="layer-container"]').on('DOMSubtreeModified', function () {
        console.log('changed two');
        if ($('[aria-label="Toast messages container"]')) {
            console.log("Toast messages container cleared");
            $('[aria-label="Toast messages container"]').empty();
        }
    });
});
Please check & confirm with your code.
Thanks
KV
If any of my replies help you to solve the problem Or gain knowledge, an upvote would be appreciated.
- Mark as New
- Bookmark Message
- Subscribe to Message
- Mute Message
- Subscribe to RSS Feed
- Permalink
- Report Inappropriate Content
Hi @kamlesh_vaghela ,
This solution worked. Thanks!
- Mark as New
- Bookmark Message
- Subscribe to Message
- Mute Message
- Subscribe to RSS Feed
- Permalink
- Report Inappropriate Content
Hi @spkriyaz , Could you please share the detailed step by step procedure to apply this solution?
- Mark as New
- Bookmark Message
- Subscribe to Message
- Mute Message
- Subscribe to RSS Feed
- Permalink
- Report Inappropriate Content
Glad to help you @spkriyaz
- Mark as New
- Bookmark Message
- Subscribe to Message
- Mute Message
- Subscribe to RSS Feed
- Permalink
- Report Inappropriate Content
Hi @kamlesh_vaghela ,
I used your javascript it restricted the error popping out from the dashboard but it impacts the filter that are in the dashboard. The filter dropdown doesn't work and after few clicks the filter vanishes. I have copied the console details below.
- Mark as New
- Bookmark Message
- Subscribe to Message
- Mute Message
- Subscribe to RSS Feed
- Permalink
- Report Inappropriate Content
Hello @kamlesh_vaghela , I'm tried your solution, but this script also disables drop down list from input of dashboard. Sometimes make this input disappear from dashboard.
Do you have any idea about it. Or Have you resolve "A custom JavaScript error caused an issue loading your dashboard."?
I'm looking forward to hearing from you.
Thank you very much.
- Mark as New
- Bookmark Message
- Subscribe to Message
- Mute Message
- Subscribe to RSS Feed
- Permalink
- Report Inappropriate Content
- Mark as New
- Bookmark Message
- Subscribe to Message
- Mute Message
- Subscribe to RSS Feed
- Permalink
- Report Inappropriate Content
I am using your JavaScript code and embedding it into this XML.
When I insert your JavaScript code, all the dropdowns and mutilselect of the inputs do not display. Almost all dashboards are affected by this issue.
Here is my XML
<form version="1.1" script="pci_view_filters.js,pci_communication_rule_activity.js">
<label>Firewall Rule Activity</label>
<fieldset autoRun="true" submitButton="true">
<input id="rule_id" token="rule" type="text">
<label>Rule</label>
<prefix>rule="</prefix>
<suffix>"</suffix>
<default></default>
</input>
<input id="dvc_id" token="dvc" type="text">
<label>Device</label>
<prefix>dvc="</prefix>
<suffix>"</suffix>
<default></default>
</input>
<input id="category_id" token="category_form" type="multiselect">
<label>Category</label>
<choice value="">All</choice>
<search>
<earliest>-1s</earliest>
<latest>now</latest>
<query>| `categories`</query>
</search>
<fieldForLabel>category</fieldForLabel>
<fieldForValue>category</fieldForValue>
<default>pci</default>
<delimiter> OR </delimiter>
<valuePrefix>`get_category(</valuePrefix>
<valueSuffix>)`</valueSuffix>
<prefix>(</prefix>
<suffix>)</suffix>
</input>
<input id="pci_domain_id" token="pci_domain_form" type="multiselect">
<label>PCI Domain</label>
<choice value="">All</choice>
<search>
<earliest>-1s</earliest>
<latest>now</latest>
<query>| `pci_domains`</query>
</search>
<fieldForLabel>pci_domain</fieldForLabel>
<fieldForValue>pci_domain</fieldForValue>
<default></default>
<delimiter> OR </delimiter>
<valuePrefix>`get_pci_domain(</valuePrefix>
<valueSuffix>)`</valueSuffix>
<prefix>(</prefix>
<suffix>)</suffix>
</input>
<input id="zero_activity_rules_id" token="zero_activity_rules" type="checkbox">
<label></label>
<choice value="0">Rules Without Activity</choice>
<prefix>Total=</prefix>
<suffix></suffix>
<default></default>
</input>
</fieldset>
<row>
<panel>
<table id="table1">
<title>Activity By Month</title>
<search>
<query>| `communication_rule_tracker`
| search $rule$ $dvc$ $category$ $pci_domain$
| appendpipe [dedup rule,dvc,vendor_product
| expectedactivity append=F fields="dvc,rule,vendor_product" earliest=-15778463s latest=+0s interval=2160000
| convert timeformat="%m" ctime(_time) as month
| convert timeformat="%Y" ctime(_time) as year]
| eval date=month."-01-".year
| convert timeformat="%m-%d-%Y" mktime(date) as _time
| `daysago(213)`
| convert timeformat="%B" ctime(_time) as month
| fillnull value=0 count
| eval date=month." (".year.")"
| eval drvp=rule."|".dvc." (".vendor_product.")"
| chart sum(count) as count over drvp by date
| makemv delim="|" drvp
| sorttimecols timeformat="%B (%Y)" direction=asc
| makemv delim="|" drvp
| rename drvp as rule
| addtotals
| sort - Total
| search $zero_activity_rules$
| fields - Total</query>
</search>
<option name="count">10</option>
<option name="wrap">true</option>
<option name="drilldown">row</option>
<drilldown>
<link>search?q=| from inputlookup:communication_rule_tracker | eval drvp=rule.",".dvc." (".vendor_product.")" | makemv delim="|" drvp | search drvp="$row.rule$" | fields - drvp &auto_pause=$auto_pause$</link>
</drilldown>
</table>
</panel>
</row>
</form>- Mark as New
- Bookmark Message
- Subscribe to Message
- Mute Message
- Subscribe to RSS Feed
- Permalink
- Report Inappropriate Content
Hi @kamlesh_vaghela,
I have this problem on Splunk Cloud, have you any idea on how to use your solution in this environment?
Ciao.
Giuseppe
- Mark as New
- Bookmark Message
- Subscribe to Message
- Mute Message
- Subscribe to RSS Feed
- Permalink
- Report Inappropriate Content
For your custom App, yes.
For third-party Apps, I don't think so. Unless Splunk Support is willing help in anyway.
- Mark as New
- Bookmark Message
- Subscribe to Message
- Mute Message
- Subscribe to RSS Feed
- Permalink
- Report Inappropriate Content
Hi @VatsalJagani ,
I trid to add the js but it wasn't possible to upload it in Splunk Cloud.
Ciao.
Giuseppe
- Mark as New
- Bookmark Message
- Subscribe to Message
- Mute Message
- Subscribe to RSS Feed
- Permalink
- Report Inappropriate Content
You can solve the error by entering the configuration panel-server configuration -internal libraries -and enable old versions


