Turn on suggestions
Auto-suggest helps you quickly narrow down your search results by suggesting possible matches as you type.
Showing results for
Dashboards & Visualizations
Turn on suggestions
Auto-suggest helps you quickly narrow down your search results by suggesting possible matches as you type.
Showing results for
- Find Answers
- :
- Using Splunk
- :
- Dashboards & Visualizations
- :
- Trellis Layout with PieChart
Options
- Subscribe to RSS Feed
- Mark Topic as New
- Mark Topic as Read
- Float this Topic for Current User
- Bookmark Topic
- Subscribe to Topic
- Mute Topic
- Printer Friendly Page
- Mark as New
- Bookmark Message
- Subscribe to Message
- Mute Message
- Subscribe to RSS Feed
- Permalink
- Report Inappropriate Content
davidcraven02
Communicator
01-22-2018
02:42 AM
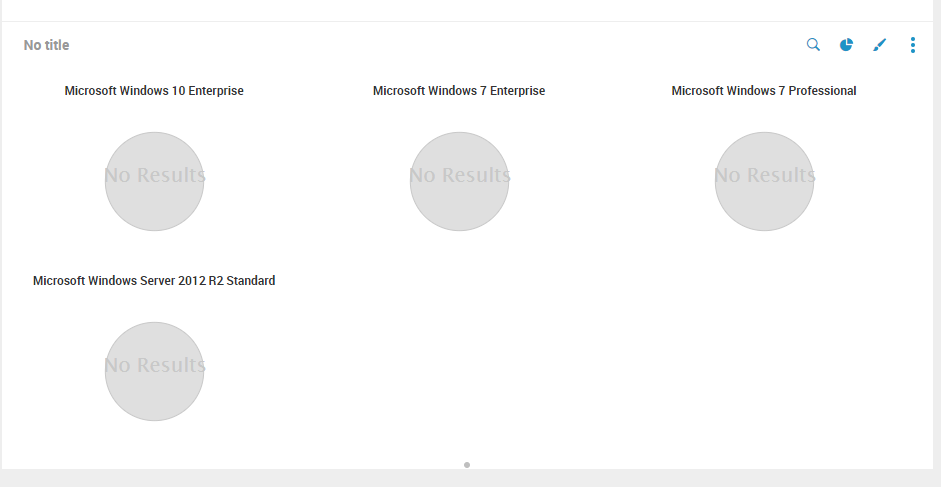
I have a pie chart which displays a breakdown of all Operating Systems but after trying to use the Trellis drill down it does not work. I don't know what I need to add in order to make it display correctly.
Please see my dashboard source code.
   <form>
       <label>OTL Client Desktops Test</label>
       <fieldset autoRun="true" submitButton="true">
       <row>
         <panel>
           <title>Operating System for client</title>
           <chart>
             <search>
               <query>`GEN_ProductionWorkstations`
                   | rename User_Name0 as LastKnownUser, Caption0 as operatingSystem, Version0 as Version, Model0 as Model
                   | search $companyCode$
                   | dedup machine
                   | stats count by operatingSystem</query>
               <earliest>$Test_Time_Range.earliest$</earliest>
               <latest>$Test_Time_Range.latest$</latest>
             </search>
             <option name="charting.axisTitleX.visibility">collapsed</option>
             <option name="charting.axisTitleY.visibility">collapsed</option>
             <option name="charting.axisTitleY2.visibility">collapsed</option>
             <option name="charting.chart">pie</option>
             <option name="charting.chart.sliceCollapsingThreshold">0.01</option>
             <option name="charting.drilldown">all</option>
             <option name="charting.legend.placement">none</option>
             <option name="height">394</option>
             <option name="refresh.display">progressbar</option>
             <option name="trellis.enabled">1</option>
             <option name="trellis.size">medium</option>
             <option name="trellis.splitBy">operatingSystem</option>
           </chart>
         </panel>
       </row>
     </form>
1 Solution
- Mark as New
- Bookmark Message
- Subscribe to Message
- Mute Message
- Subscribe to RSS Feed
- Permalink
- Report Inappropriate Content
493669
Super Champion
01-22-2018
03:10 AM
Try below:
<form>
        <label>OTL Client Desktops Test</label>
        <fieldset autoRun="true" submitButton="true">
        <row>
          <panel>
            <title>Operating System for client</title>
            <chart>
              <search>
                <query>`GEN_ProductionWorkstations`
                    | rename User_Name0 as LastKnownUser, Caption0 as operatingSystem, Version0 as Version, Model0 as Model
                    | search $companyCode$
                    | dedup machine
                    | stats count by operatingSystem Version</query>
                <earliest>$Test_Time_Range.earliest$</earliest>
                <latest>$Test_Time_Range.latest$</latest>
              </search>
              <option name="charting.axisTitleX.visibility">collapsed</option>
              <option name="charting.axisTitleY.visibility">collapsed</option>
              <option name="charting.axisTitleY2.visibility">collapsed</option>
              <option name="charting.chart">pie</option>
              <option name="charting.chart.sliceCollapsingThreshold">0.01</option>
              <option name="charting.drilldown">all</option>
              <option name="charting.legend.placement">none</option>
              <option name="height">394</option>
              <option name="refresh.display">progressbar</option>
              <option name="trellis.enabled">1</option>
              <option name="trellis.size">medium</option>
              <option name="trellis.splitBy">operatingSystem</option>
            </chart>
          </panel>
        </row>
      </form>
It seems you need to add one more field in stats by clause
Hope this helps...
- Mark as New
- Bookmark Message
- Subscribe to Message
- Mute Message
- Subscribe to RSS Feed
- Permalink
- Report Inappropriate Content
davidcraven02
Communicator
01-22-2018
04:45 AM
Absolute legend! Thank you!!!!
- Mark as New
- Bookmark Message
- Subscribe to Message
- Mute Message
- Subscribe to RSS Feed
- Permalink
- Report Inappropriate Content
493669
Super Champion
01-22-2018
03:10 AM
Try below:
<form>
        <label>OTL Client Desktops Test</label>
        <fieldset autoRun="true" submitButton="true">
        <row>
          <panel>
            <title>Operating System for client</title>
            <chart>
              <search>
                <query>`GEN_ProductionWorkstations`
                    | rename User_Name0 as LastKnownUser, Caption0 as operatingSystem, Version0 as Version, Model0 as Model
                    | search $companyCode$
                    | dedup machine
                    | stats count by operatingSystem Version</query>
                <earliest>$Test_Time_Range.earliest$</earliest>
                <latest>$Test_Time_Range.latest$</latest>
              </search>
              <option name="charting.axisTitleX.visibility">collapsed</option>
              <option name="charting.axisTitleY.visibility">collapsed</option>
              <option name="charting.axisTitleY2.visibility">collapsed</option>
              <option name="charting.chart">pie</option>
              <option name="charting.chart.sliceCollapsingThreshold">0.01</option>
              <option name="charting.drilldown">all</option>
              <option name="charting.legend.placement">none</option>
              <option name="height">394</option>
              <option name="refresh.display">progressbar</option>
              <option name="trellis.enabled">1</option>
              <option name="trellis.size">medium</option>
              <option name="trellis.splitBy">operatingSystem</option>
            </chart>
          </panel>
        </row>
      </form>
It seems you need to add one more field in stats by clause
Hope this helps...
- Mark as New
- Bookmark Message
- Subscribe to Message
- Mute Message
- Subscribe to RSS Feed
- Permalink
- Report Inappropriate Content
493669
Super Champion
01-22-2018
02:51 AM
If you try to run below query in search in your app:
  `GEN_ProductionWorkstations`
                        | rename User_Name0 as LastKnownUser, Caption0 as operatingSystem, Version0 as Version, Model0 as Model
What is the output you are receiving
- Mark as New
- Bookmark Message
- Subscribe to Message
- Mute Message
- Subscribe to RSS Feed
- Permalink
- Report Inappropriate Content
davidcraven02
Communicator
01-22-2018
03:03 AM
What was the reason for this? It runs and returns data
Get Updates on the Splunk Community!
Now Available: Cisco Talos Threat Intelligence Integrations for Splunk Security Cloud ...
At .conf24, we shared that we were in the process of integrating Cisco Talos threat intelligence into Splunk ...
Preparing your Splunk Environment for OpenSSL3
The Splunk platform will transition to OpenSSL version 3 in a future release. Actions are required to prepare ...
Easily Improve Agent Saturation with the Splunk Add-on for OpenTelemetry Collector
Agent Saturation What and Whys
In application performance monitoring, saturation is defined as the total load ...

