- Splunk Answers
- :
- Using Splunk
- :
- Dashboards & Visualizations
- :
- Re: Summary index use in dashboard
- Subscribe to RSS Feed
- Mark Topic as New
- Mark Topic as Read
- Float this Topic for Current User
- Bookmark Topic
- Subscribe to Topic
- Mute Topic
- Printer Friendly Page
- Mark as New
- Bookmark Message
- Subscribe to Message
- Mute Message
- Subscribe to RSS Feed
- Permalink
- Report Inappropriate Content
To obtain the results in a dashboard I am using following things.
1.) First I created datamodel
2.) Datamodel I have used in macros which is running 1h and 1d basis.
3. pass those macros in saved search and collect the results in hourly and daily basis.
4. Results of the span_token is passing to macro from the below dashboard code.
5. As I am attaching macros and saved searches at the end of the dashboard code.
Issue : I am not getting proper results by using this approach and dashboard is not populating results properly. I need gidance to fix the issue.
====================================================================
<form version="1.1" theme="light">
<label>Throughput : Highbay</label>
<init>
<set token="span_token">$form.span_token$</set>
</init>
<fieldset submitButton="false"></fieldset>
<row>
<panel>
<input type="time" token="time" id="my_date_range" searchWhenChanged="true">
<label>Select the Time Range</label>
<default>
<earliest>-7d@h</earliest>
<latest>now</latest>
</default>
<change>
<eval token="time.earliest_epoch">if('earliest'="",0,if(isnum(strptime('earliest', "%s")),'earliest',relative_time(now(),'earliest')))</eval>
<eval token="time.latest_epoch">if(isnum(strptime('latest', "%s")),'latest',relative_time(now(),'latest'))</eval>
<eval token="macro_token">if($time.latest_epoch$ - $time.earliest_epoch$ > 2592000, "throughput_macro_summary_1d",if($time.latest_epoch$ - $time.earliest_epoch$ > 86400, "throughput_macro_summary_1h","throughput_macro_raw"))</eval>
<eval token="form.span_token">if($time.latest_epoch$ - $time.earliest_epoch$ > 2592000, "d", if($time.latest_epoch$ - $time.earliest_epoch$ > 86400, "h", $form.span_token$))</eval>
</change>
</input>
</panel>
</row>
<row>
<panel>
<chart>
<title>Total Pallet</title>
<search>
<query>|`$macro_token$(span_token="$span_token$")`
| search LocationQualifiedName="*/Aisle*Entry*" OR LocationQualifiedName="*/Aisle*Exit*"
|strcat "raw" "," location group_name | timechart sum(count) as cnt by location</query>
<earliest>$time.earliest$</earliest>
<latest>$time.latest$</latest>
</search>
<option name="charting.chart">column</option>
<option name="charting.chart.stackMode">stacked</option>
<option name="charting.drilldown">none</option>
<option name="refresh.display">progressbar</option>
</chart>
</panel>
</row>
<row>
<panel>
<chart>
<title>Pallet IN</title>
<search>
<query>|`$macro_token$(span_token="$span_token$")`
| search LocationQualifiedName="*/Aisle*Entry*"
|strcat "raw" "," location group_name | timechart sum(count) as cnt by location</query>
<earliest>$time.earliest$</earliest>
<latest>$time.latest$</latest>
</search>
<option name="charting.chart">column</option>
<option name="charting.chart.stackMode">stacked</option>
<option name="charting.drilldown">none</option>
<option name="refresh.display">progressbar</option>
</chart>
</panel>
</row>
<row>
<panel>
<chart>
<title>Pallet OUT</title>
<search>
<query>|`$macro_token$(span_token="$span_token$")`
| search LocationQualifiedName="*/Aisle*Exit*"
|strcat "raw" "," location group_name | timechart sum(count) as cnt by location</query>
<earliest>$time.earliest$</earliest>
<latest>$time.latest$</latest>
</search>
<option name="charting.chart">column</option>
<option name="charting.chart.stackMode">stacked</option>
<option name="charting.drilldown">none</option>
<option name="refresh.display">progressbar</option>
</chart>
</panel>
</row>
</form>
=======================================
Macros:
throughput_macro_raw(1)
datamodel Walmart_throughput Highbay_throughput flat | bin _time span="$span_token$" | rename AsrTsuEventTrackingUpdate.LocationQualifiedName as LocationQualifiedName | table + _time LocationQualifiedName location date_hour date_mday date_minute date_month date_month date_second date_wday date_year
throughput_macro_summary_1d(1)
search index="tput_summary" sourcetype="tput_summary_1d" | bin _time span="$span_token$" | table + _time LocationQualifiedName location date_hour date_mday date_minute date_month date_month date_second date_wday date_year count
throughput_macro_summary_1h(1)
search index="tput_summary" sourcetype="tput_summary_1h" | bin _time span=$span_token$ | table + _time LocationQualifiedName location date_hour date_mday date_minute date_month date_month date_second date_wday date_year count
saved searches:
throughput_summary_index_1d
| `throughput_macro_raw(span_token="1d")`
|strcat "raw" "," location group_name |strcat "raw" "," location group_name | stats count by location _time LocationQualifiedName
| collect index="tput_summary" sourcetype="tput_summary_1d"
throughput_summary_index_1h
| `throughput_macro_raw(span_token="1h")`
|strcat "raw" "," location group_name | stats count by location _time LocationQualifiedName
| collect index="tput_summary" sourcetype="tput_summary_1h"
- Mark as New
- Bookmark Message
- Subscribe to Message
- Mute Message
- Subscribe to RSS Feed
- Permalink
- Report Inappropriate Content
index="tput_summary" sourcetype="tput_summary_1d"
| bin _time span="h"
| table + _time LocationQualifiedName location date_hour date_mday date_minute date_month date_month date_second date_wday date_year count
| where like(LocationQualifiedName, "%/Aisle%Entry%")
| strcat "raw" "," location group_name
| where like(LocationQualifiedName,"%/Aisle%Entry%") OR like(LocationQualifiedName,"%/Aisle%Exit%")
| strcat "raw" "," location group_name
| timechart sum(count) as cnt by location- Mark as New
- Bookmark Message
- Subscribe to Message
- Mute Message
- Subscribe to RSS Feed
- Permalink
- Report Inappropriate Content
What is the issue? ("not getting proper results" and "not populating results properly" do not really explain what is wrong.)
- Mark as New
- Bookmark Message
- Subscribe to Message
- Mute Message
- Subscribe to RSS Feed
- Permalink
- Report Inappropriate Content
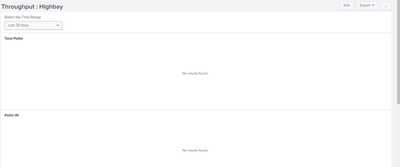
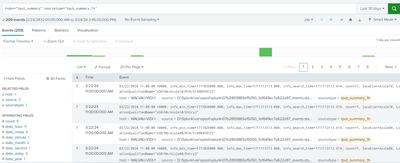
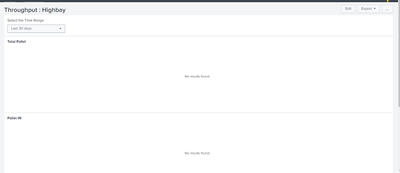
Summary indexing is giving the results for 30 days but results are not populating the dashboard.
No results populating in a dashboards when search for 30 days.
- Mark as New
- Bookmark Message
- Subscribe to Message
- Mute Message
- Subscribe to RSS Feed
- Permalink
- Report Inappropriate Content
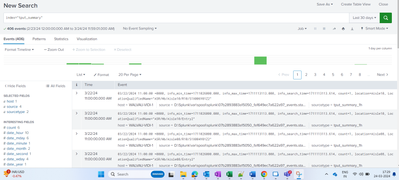
Try opening the panel search in a search window and see what your searches are
- Mark as New
- Bookmark Message
- Subscribe to Message
- Mute Message
- Subscribe to RSS Feed
- Permalink
- Report Inappropriate Content
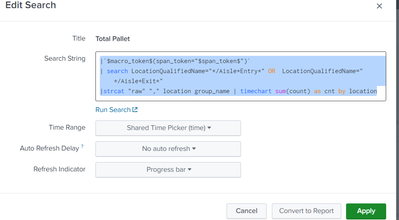
@ITWhisperer Below is the search I am using in a panel
|`$macro_token$(span_token="$span_token$")`
| search LocationQualifiedName="*/Aisle*Entry*" OR LocationQualifiedName="*/Aisle*Exit*"
|strcat "raw" "," location group_name | timechart sum(count) as cnt by location
Screenshot:
- Mark as New
- Bookmark Message
- Subscribe to Message
- Mute Message
- Subscribe to RSS Feed
- Permalink
- Report Inappropriate Content
Try expanding the macros in the search to see what they are actually doing
- Mark as New
- Bookmark Message
- Subscribe to Message
- Mute Message
- Subscribe to RSS Feed
- Permalink
- Report Inappropriate Content
@ITWhisperer While expanding macros I am getting below search :
index="tput_summary" sourcetype="tput_summary_1d"
| bin _time span="h"
| table + _time LocationQualifiedName location date_hour date_mday date_minute date_month date_month date_second date_wday date_year count
| search LocationQualifiedName="*/Aisle*Entry*"
| strcat "raw" "," location group_name
| timechart sum(count) as cnt by location
Above search is not producing any results.
- Mark as New
- Bookmark Message
- Subscribe to Message
- Mute Message
- Subscribe to RSS Feed
- Permalink
- Report Inappropriate Content
Your previous search returned events from tput_summary_1h whereas this latest search is used tput_summary_1d - check that there are events in your summary index for the *_1d sourcetype
- Mark as New
- Bookmark Message
- Subscribe to Message
- Mute Message
- Subscribe to RSS Feed
- Permalink
- Report Inappropriate Content
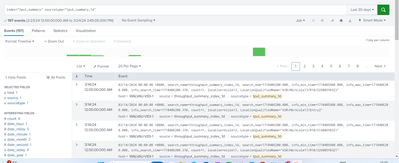
Events are present in sourcetype="tput_summary_1d" for 30 days
Events are present in sourcetype="tput_summary_1h" for 30 days
Please guide me on this
- Mark as New
- Bookmark Message
- Subscribe to Message
- Mute Message
- Subscribe to RSS Feed
- Permalink
- Report Inappropriate Content
What does this search return?
index="tput_summary" sourcetype="tput_summary_1d"
| bin _time span="h"
| table + _time LocationQualifiedName location date_hour date_mday date_minute date_month date_month date_second date_wday date_year count
| search LocationQualifiedName="*/Aisle*Entry*"
| strcat "raw" "," location group_name- Mark as New
- Bookmark Message
- Subscribe to Message
- Mute Message
- Subscribe to RSS Feed
- Permalink
- Report Inappropriate Content
- Mark as New
- Bookmark Message
- Subscribe to Message
- Mute Message
- Subscribe to RSS Feed
- Permalink
- Report Inappropriate Content
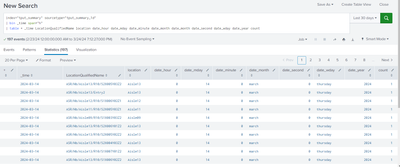
How about this search
index="tput_summary" sourcetype="tput_summary_1d"
| bin _time span="h"
| table + _time LocationQualifiedName location date_hour date_mday date_minute date_month date_month date_second date_wday date_year count- Mark as New
- Bookmark Message
- Subscribe to Message
- Mute Message
- Subscribe to RSS Feed
- Permalink
- Report Inappropriate Content
- Mark as New
- Bookmark Message
- Subscribe to Message
- Mute Message
- Subscribe to RSS Feed
- Permalink
- Report Inappropriate Content
Try using where and like() instead of search
index="tput_summary" sourcetype="tput_summary_1d"
| bin _time span="h"
| table + _time LocationQualifiedName location date_hour date_mday date_minute date_month date_month date_second date_wday date_year count
| where like(LocationQualifiedName, "%/Aisle%Entry%")
| strcat "raw" "," location group_name- Mark as New
- Bookmark Message
- Subscribe to Message
- Mute Message
- Subscribe to RSS Feed
- Permalink
- Report Inappropriate Content
@ITWhisperer I have modified the changes as per your suggestion in the macros. But now I am seeing issue persist with the data.
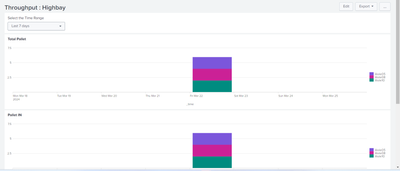
When I select for 7 days, data is visible in a dashboard. Query and dashboard screenshot is attached below.
index="tput_summary" sourcetype="tput_summary_1h"
| bin _time span=h
| table + _time LocationQualifiedName location date_hour date_mday date_minute date_month date_month date_second date_wday date_year count
| where like(LocationQualifiedName, "%/Aisle%Entry%")
| strcat "raw" "," location group_name
| search LocationQualifiedName="*/Aisle*Entry*" OR LocationQualifiedName="*/Aisle*Exit*"
| strcat "raw" "," location group_name
| timechart sum(count) as cnt by location
When I have select for 30 days . There is no data visible in a dashboard. You can see query also.
index="tput_summary" sourcetype="tput_summary_1d"
| bin _time span="h"
| table + _time LocationQualifiedName location date_hour date_mday date_minute date_month date_month date_second date_wday date_year count
| where like(LocationQualifiedName, "%/Aisle%Entry%")
| strcat "raw" "," location group_name
| search LocationQualifiedName="*/Aisle*Entry*" OR LocationQualifiedName="*/Aisle*Exit*"
| strcat "raw" "," location group_name
| timechart sum(count) as cnt by location
- Mark as New
- Bookmark Message
- Subscribe to Message
- Mute Message
- Subscribe to RSS Feed
- Permalink
- Report Inappropriate Content
Try changing the other search commands to their corresponding where commands
- Mark as New
- Bookmark Message
- Subscribe to Message
- Mute Message
- Subscribe to RSS Feed
- Permalink
- Report Inappropriate Content
@ITWhisperer I have used below code to obtain token results in macros ?Please provide your suggestion, is there any changes need ?
<change>
<eval token="time.earliest_epoch">if('earliest'="",0,if(isnum(strptime('earliest', "%s")),'earliest',relative_time(now(),'earliest')))</eval>
<eval token="time.latest_epoch">if(isnum(strptime('latest', "%s")),'latest',relative_time(now(),'latest'))</eval>
<eval token="macro_token">if($time.latest_epoch$ - $time.earliest_epoch$ > 2592000, "throughput_macro_summary_1d",if($time.latest_epoch$ - $time.earliest_epoch$ > 86400, "throughput_macro_summary_1h","throughput_macro_raw"))</eval>
<eval token="form.span_token">if($time.latest_epoch$ - $time.earliest_epoch$ > 2592000, "d", if($time.latest_epoch$ - $time.earliest_epoch$ > 86400, "h", $form.span_token$))</eval>
</change>
- Mark as New
- Bookmark Message
- Subscribe to Message
- Mute Message
- Subscribe to RSS Feed
- Permalink
- Report Inappropriate Content
index="tput_summary" sourcetype="tput_summary_1d"
| bin _time span="h"
| table + _time LocationQualifiedName location date_hour date_mday date_minute date_month date_month date_second date_wday date_year count
| where like(LocationQualifiedName, "%/Aisle%Entry%")
| strcat "raw" "," location group_name
| where like(LocationQualifiedName,"%/Aisle%Entry%") OR like(LocationQualifiedName,"%/Aisle%Exit%")
| strcat "raw" "," location group_name
| timechart sum(count) as cnt by location- Mark as New
- Bookmark Message
- Subscribe to Message
- Mute Message
- Subscribe to RSS Feed
- Permalink
- Report Inappropriate Content
@ITWhisperer Now code is working, I have modified it in a dashboard.
Thanks for your throughout genius help.
