Join the Conversation
- Find Answers
- :
- Using Splunk
- :
- Dashboards & Visualizations
- :
- Simple XML Dashboard - Table Panel Formating Query
- Subscribe to RSS Feed
- Mark Topic as New
- Mark Topic as Read
- Float this Topic for Current User
- Bookmark Topic
- Subscribe to Topic
- Mute Topic
- Printer Friendly Page
- Mark as New
- Bookmark Message
- Subscribe to Message
- Mute Message
- Subscribe to RSS Feed
- Permalink
- Report Inappropriate Content
Hello,
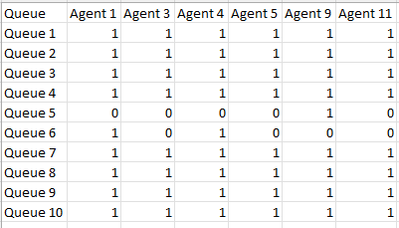
I am creating a dashboard (Simple XML) with a table panel as shown below:
This is actually a dashboard for Telephony System and number of columns (and names, of course) will be changed based on which agents are logged in at a time. For example,
- at 9 AM: Queue, Agent 1, Agent 4, Agent 9
- at 3 PM: Queue, Agent 1, Agent 4, Agent 5, Agent 11
- at 1 AM: Queue, Agent 5, Agent 9, Agent 11
Now, in this table panel, I want to replace 1 with Green Tick and 0 with Red Cross in all the columns.
Can you please suggest how this can be achieved? I have tried this using eval and replace but as columns are dynamic, I am unable to handle this.
Thank you.
Edit:
Sample JSON Event:
{
AAAA_PMC_DT: 05-Dec-2023 13:04:34
Agent: Agent 1
Block: RTAgentsLoggedIn
Bound: in
Queue(s):: Queue 1, Queue 3, Queue 4, Queue 5, Queue 7, Queue 10
}
SPL:
index="telephony_test" Bound=in Block=RTAgentsLoggedIn _index_earliest=-5m@m _index_latest=@s
      | spath "Agent"
| spath "Queue(s):"
| spath "On pause"
| spath AAAA_PMC_DT
| fields "Agent" "Queue(s):" "On pause" AAAA_PMC_DT
| rename "Queue(s):" as Queue, "On pause" as OnPause, AAAA_PMC_DT as LastDataFetch
| eval _time=strptime(LastDataFetch,"%d-%b-%Y %H:%M:%S")
| where _time>=relative_time(now(),"-300s@s")
| where NOT LIKE(Queue,"%Outbound%")
| sort 0 -_time Agent
| dedup Agent
| eval Queue=split(Queue,", ")
| table Agent Queue
| mvexpand Queue
| chart limit=0 count by Queue Agent
- Mark as New
- Bookmark Message
- Subscribe to Message
- Mute Message
- Subscribe to RSS Feed
- Permalink
- Report Inappropriate Content
You can try like this:
| makeresults
| eval Title="title",'First name'=1,'Second name'=0
| foreach "*"
    [ eval <<FIELD>>=if ("<<MATCHSTR>>"=="Title","Title",if(<<FIELD>>=1,"Yes","No")) ]
- Mark as New
- Bookmark Message
- Subscribe to Message
- Mute Message
- Subscribe to RSS Feed
- Permalink
- Report Inappropriate Content
Regardless of actually rendering it in your dashboard, if you have dynamically created set of fields, you can use the foreach command.
Like this (a run-anywhere example
| makeresults
| eval Agent1=0,Agent2=1
| foreach "Agent*"
    [ eval <<FIELD>>=if (<<FIELD>>==1,"✓","x")]
The downside of the foreach command is that it's tricky with spaces within field names.
- Mark as New
- Bookmark Message
- Subscribe to Message
- Mute Message
- Subscribe to RSS Feed
- Permalink
- Report Inappropriate Content
thanks, @PickleRick - this almost worked. Only thing is Columns "Agent 1, Agent 2, Agent 3 ...." are actual Agent Names so below will not work. How can I use this foreach so it includes all columns except Column "Queue"?
| foreach "Agent*"
Thank you.
Edit: I was able to handle spaces within the field names referring to below link:
- Mark as New
- Bookmark Message
- Subscribe to Message
- Mute Message
- Subscribe to RSS Feed
- Permalink
- Report Inappropriate Content
Slight variation on @PickleRick example, your foreach statement only needs to be
| foreach "*"
    [ eval <<FIELD>>=case('<<FIELD>>'=0, "❌",
                          '<<FIELD>>'>0, "✅",
                          1==1, '<<FIELD>>')
    ]
The above allows for count > 1 with the green tick, but if it will either be 0 or 1 then you can make it so
There is no need to test for the queue name, as long as it's never numeric
- Mark as New
- Bookmark Message
- Subscribe to Message
- Mute Message
- Subscribe to RSS Feed
- Permalink
- Report Inappropriate Content
thanks @bowesmana - Unfortunately, I could not accept 2 answers but this helped. Thank you.
- Mark as New
- Bookmark Message
- Subscribe to Message
- Mute Message
- Subscribe to RSS Feed
- Permalink
- Report Inappropriate Content
You can try like this:
| makeresults
| eval Title="title",'First name'=1,'Second name'=0
| foreach "*"
    [ eval <<FIELD>>=if ("<<MATCHSTR>>"=="Title","Title",if(<<FIELD>>=1,"Yes","No")) ]
- Mark as New
- Bookmark Message
- Subscribe to Message
- Mute Message
- Subscribe to RSS Feed
- Permalink
- Report Inappropriate Content
thanks @PickleRick

