- Find Answers
- :
- Using Splunk
- :
- Dashboards & Visualizations
- :
- Search head dashboards receiving warning "Unable t...
- Subscribe to RSS Feed
- Mark Topic as New
- Mark Topic as Read
- Float this Topic for Current User
- Bookmark Topic
- Subscribe to Topic
- Mute Topic
- Printer Friendly Page
- Mark as New
- Bookmark Message
- Subscribe to Message
- Mute Message
- Subscribe to RSS Feed
- Permalink
- Report Inappropriate Content
Search head dashboards receiving warning "Unable to distribute to peer named"
Hi Splunker's
I use Splunk 7- in a cluster environment: 3 index; 1 search head; 1 utility server.
After installation and migration, at search head when I run the dashboards I find the following warning:
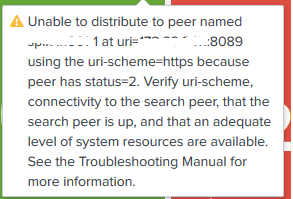
Unable to distribute to peer xxxx at uri xxxx using the uri-shema = beacause sttps peer has status = 2. Verify uri-sheme connectivity to the search peer. and research does not deal with the full range of time.
However, when I run the report in a search it displays correctly.
The attachment shows the indexer log and error in the search head.
Can anyone help? Thank you.
- Mark as New
- Bookmark Message
- Subscribe to Message
- Mute Message
- Subscribe to RSS Feed
- Permalink
- Report Inappropriate Content
@amitm05
Thanks for your reply, the error of log indexer is only displayed in two indexers.
Now I just check the log two indexer shows the error in warning.
and at the level of the search I do not see anymore the warning but the SH is long and it does not display any data.
for indexers, the UF sends data only for two indexers. the third receives the data after replication.
It may be the cause of the problem?
- Mark as New
- Bookmark Message
- Subscribe to Message
- Mute Message
- Subscribe to RSS Feed
- Permalink
- Report Inappropriate Content
Not seeing the warning on the search and only on the dashboard would again point that it could be a system resourcing issue.
As a single query might not be hurting But multiple queries fired through the dashboard at same time cause the indexer to throw this warning.
For the part that "UF sends data only for two indexers" -
This makes this difference that these 2 indexers are working more than the third one. Because all the indexing jobs are done by these 2. And moreover your 3rd indexer doesn't have any searchable copy of data but only replication data. So actually this 3rd indexer isn't responding for any requests from the search head. So lets just say that the 3rd peer isnt throwing any warning because its not being asked for providing the search data.
- Mark as New
- Bookmark Message
- Subscribe to Message
- Mute Message
- Subscribe to RSS Feed
- Permalink
- Report Inappropriate Content
@TISKAR
ques - is it always the same peer OR it is occurring for all peers ? Based on this answer, you'll have to troubleshoot and optimize on your indexer resources.
This happens when your indexer is oversubscribed i.e. the load on the indexer is not consistent with other search peers. This can happen if you choose to opt different physical configurations for your peers/indexers (This can be one of the primary reasons but not the only one ).
Also refer this post -
https://answers.splunk.com/answers/694362/when-trying-to-set-up-a-distributed-system-can-you.html
Hope this helps.
- Mark as New
- Bookmark Message
- Subscribe to Message
- Mute Message
- Subscribe to RSS Feed
- Permalink
- Report Inappropriate Content
@TISKAR check that its added as your search peer in Distributed search. You are able to see results because data is being fetched from the one of the indexer on indexer cluster, as your search factor is probably 2.
- Mark as New
- Bookmark Message
- Subscribe to Message
- Mute Message
- Subscribe to RSS Feed
- Permalink
- Report Inappropriate Content
@Vijeta,
Thank you for your response,
the query returns to a result, but it does not show totals the data, when I select an interval between 08H and 23H it displays that the data between 20H and 23H
- Mark as New
- Bookmark Message
- Subscribe to Message
- Mute Message
- Subscribe to RSS Feed
- Permalink
- Report Inappropriate Content
Did you check Monitoring console about that server's health May be not adequate resources are available on it.
- Mark as New
- Bookmark Message
- Subscribe to Message
- Mute Message
- Subscribe to RSS Feed
- Permalink
- Report Inappropriate Content
Yes i did it all peer have status Healthy


