Turn on suggestions
Auto-suggest helps you quickly narrow down your search results by suggesting possible matches as you type.
Dashboards & Visualizations
×
Join the Conversation
Without signing in, you're just watching from the sidelines. Sign in or Register to connect, share, and be part of the Splunk Community.
Turn on suggestions
Auto-suggest helps you quickly narrow down your search results by suggesting possible matches as you type.
- Find Answers
- :
- Using Splunk
- :
- Dashboards & Visualizations
- :
- Pie Chart with Number + DrillDown click.value
Options
- Subscribe to RSS Feed
- Mark Topic as New
- Mark Topic as Read
- Float this Topic for Current User
- Bookmark Topic
- Subscribe to Topic
- Mute Topic
- Printer Friendly Page
- Mark as New
- Bookmark Message
- Subscribe to Message
- Mute Message
- Subscribe to RSS Feed
- Permalink
- Report Inappropriate Content
CcCcCcCcCc1
New Member
04-29-2020
01:39 AM
https://answers.splunk.com/answers/562629/how-to-configure-pie-chart-to-display-count-within.html
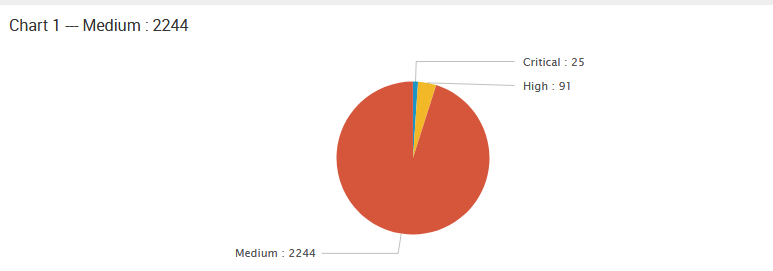
same as above post, would like to have a pie chart with its count, so followed the post and its work, it can show the Count in Pie Chart
... | stats Count by Severity | eval SeverityCount=Severity." : ".Count | fields SeverityCount, Count
Beside, we still have a token to Pass the Severity Critical/High/Medium to chart 2 for drilldown base on what we click
unfortunately, it's now passing Critical : 25 instead of passing Critical to chart 2 when we click on it, which cause the chart 2 not working.
    <drilldown>
    <set token="Severity">$click.value$</set>
    </drilldown>
would like to seek any way can fulfill both requirements ( Show Count in Pie Chart + Pass the correct Value to Chart 2 ) ? 😐
1 Solution
- Mark as New
- Bookmark Message
- Subscribe to Message
- Mute Message
- Subscribe to RSS Feed
- Permalink
- Report Inappropriate Content
vnravikumar
Champion
04-29-2020
03:23 AM
Hi
Try with
        <drilldown>
          <eval token="test">replace('click.value',"(:[^:]+)$","")</eval>
        </drilldown>
- Mark as New
- Bookmark Message
- Subscribe to Message
- Mute Message
- Subscribe to RSS Feed
- Permalink
- Report Inappropriate Content
vnravikumar
Champion
04-29-2020
03:23 AM
Hi
Try with
        <drilldown>
          <eval token="test">replace('click.value',"(:[^:]+)$","")</eval>
        </drilldown>
- Mark as New
- Bookmark Message
- Subscribe to Message
- Mute Message
- Subscribe to RSS Feed
- Permalink
- Report Inappropriate Content
CcCcCcCcCc1
New Member
04-29-2020
07:10 AM
Awesome, it's solved !!! thx Bro 🙂
Get Updates on the Splunk Community!
Data Management Digest – December 2025
Welcome to the December edition of Data Management Digest!
As we continue our journey of data innovation, the ...
Index This | What is broken 80% of the time by February?
December 2025 Edition
Hayyy Splunk Education Enthusiasts and the Eternally Curious!
We’re back with this ...
Unlock Faster Time-to-Value on Edge and Ingest Processor with New SPL2 Pipeline ...
Hello Splunk Community,
We're thrilled to share an exciting update that will help you manage your data more ...

