Turn on suggestions
Auto-suggest helps you quickly narrow down your search results by suggesting possible matches as you type.
Dashboards & Visualizations
×
Are you a member of the Splunk Community?
Sign in or Register with your Splunk account to get your questions answered, access valuable resources and connect with experts!
Turn on suggestions
Auto-suggest helps you quickly narrow down your search results by suggesting possible matches as you type.
- Find Answers
- :
- Using Splunk
- :
- Dashboards & Visualizations
- :
- Merge lines in multiseries graph
Options
- Subscribe to RSS Feed
- Mark Topic as New
- Mark Topic as Read
- Float this Topic for Current User
- Bookmark Topic
- Subscribe to Topic
- Mute Topic
- Printer Friendly Page
- Mark as New
- Bookmark Message
- Subscribe to Message
- Mute Message
- Subscribe to RSS Feed
- Permalink
- Report Inappropriate Content
Merge lines in multiseries graph
PavelNed
Explorer
12-08-2020
07:46 AM
Hi guys,
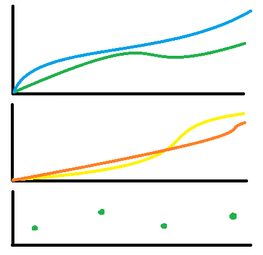
I am trying to make a panel with multiple vertical graphs, where each of these graphs can have one or multiple lines of data. Let's say first graph could be desired/present voltage over time, second desired/present current over time etc.
Basically I am looking for a way how to use multi-series mode so that there is not a graph for each line, but for merged ones. My desired output should look something like this:
Any ideas how to do that?
Thanks for your answers.
Get Updates on the Splunk Community!
Splunk Observability as Code: From Zero to Dashboard
For the details on what Self-Service Observability and Observability as Code is, we have some awesome content ...
[Puzzles] Solve, Learn, Repeat: Character substitutions with Regular Expressions
This challenge was first posted on Slack #puzzles channelFor BORE at .conf23, we had a puzzle question which ...
Shape the Future of Splunk: Join the Product Research Lab!
Join the Splunk Product Research Lab and connect with us in the Slack channel #product-research-lab to get ...

