Are you a member of the Splunk Community?
- Find Answers
- :
- Using Splunk
- :
- Dashboards & Visualizations
- :
- How to visualize periodic website health check res...
- Subscribe to RSS Feed
- Mark Topic as New
- Mark Topic as Read
- Float this Topic for Current User
- Bookmark Topic
- Subscribe to Topic
- Mute Topic
- Printer Friendly Page
- Mark as New
- Bookmark Message
- Subscribe to Message
- Mute Message
- Subscribe to RSS Feed
- Permalink
- Report Inappropriate Content
How to visualize periodic website health check results in a Splunk dashboard?
This seems like a very common use case, to simply visualize results of some health checks against some system (like server, website, service, ...) but I can't figure out how to do it in a Splunk dashboard. Here are the details for my use case:
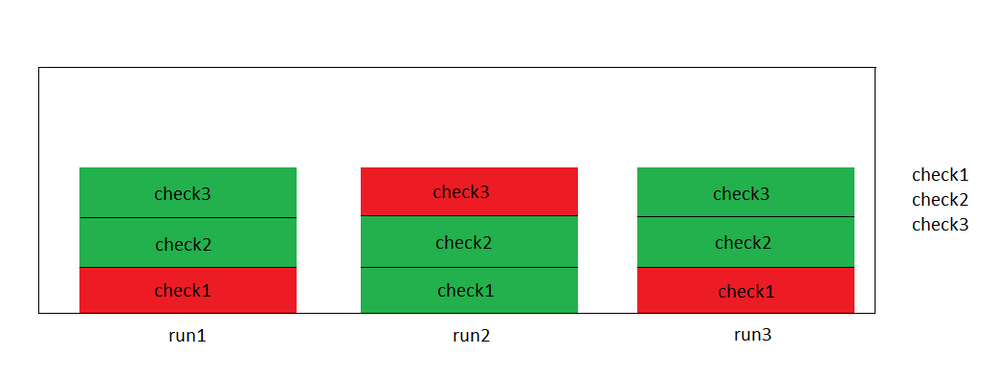
I have multiple health checks (check1, check2, check3, ...) that are run periodically (run1, run2, run3, ...) against a website. Any suggestions how can I create dashboard that shows them in a following straightforward way?
- checks are stacked in a column
- if check passed its color is green
- if check failed its color is red
Here is a basic example:
Note, that check's name does not have to be displayed in the column, I put it there just to demonstrate the idea 🙂
In case splunk can't do this, is there any alternative approach?
- Mark as New
- Bookmark Message
- Subscribe to Message
- Mute Message
- Subscribe to RSS Feed
- Permalink
- Report Inappropriate Content
Hi rehak_michal,
Take a look at this App https://splunkbase.splunk.com/app/1493/ which will provide a testing script and some dashboards. Beside that and as mentioned by @sundareshr look at the Splunk dashboard examples https://splunkbase.splunk.com/app/1603/
Hope that helps ...
cheers, MuS
- Mark as New
- Bookmark Message
- Subscribe to Message
- Mute Message
- Subscribe to RSS Feed
- Permalink
- Report Inappropriate Content
Take a look at Splunk 6.x Dashboard Examples You may get some ideas
- Mark as New
- Bookmark Message
- Subscribe to Message
- Mute Message
- Subscribe to RSS Feed
- Permalink
- Report Inappropriate Content
Thanks. Is there any example that matches my description and screenshot? I can't seem to find anything like that. I just need to display column for every check an set its color based on the check's result.

