Are you a member of the Splunk Community?
- Find Answers
- :
- Using Splunk
- :
- Dashboards & Visualizations
- :
- Re: How to set a single value result to show the T...
- Subscribe to RSS Feed
- Mark Topic as New
- Mark Topic as Read
- Float this Topic for Current User
- Bookmark Topic
- Subscribe to Topic
- Mute Topic
- Printer Friendly Page
- Mark as New
- Bookmark Message
- Subscribe to Message
- Mute Message
- Subscribe to RSS Feed
- Permalink
- Report Inappropriate Content
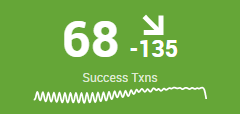
How to set a single value result to show the Total and have a sparkline showing the trending average underneath?
To my understanding, single value uses the first value of the result table.
However, how do I build the search for the single value panel to show the total and sparkline underneath to show average?
Also, how do I change the trend indicator to compare current total and total an hour ago?
- Mark as New
- Bookmark Message
- Subscribe to Message
- Mute Message
- Subscribe to RSS Feed
- Permalink
- Report Inappropriate Content
If you'd like to see the total as the "main" single value, you'll have to forfeit the use of timechart (since this will be time-based), which will then forfeit the sparkline and trend indicator. I think you best bet may be to separate this into two different single value visualizations. One single value visualization for the running total, and a separate one where you show the 15 min average, which will can include the trend from an hour ago.
- Mark as New
- Bookmark Message
- Subscribe to Message
- Mute Message
- Subscribe to RSS Feed
- Permalink
- Report Inappropriate Content
- Mark as New
- Bookmark Message
- Subscribe to Message
- Mute Message
- Subscribe to RSS Feed
- Permalink
- Report Inappropriate Content
I'm trying to achieve something very similar (without the trend part). I can show the total using addcoltotals, however, then the sparkline is messed up. Then, when I have a nice sparkline, then the total is nowhere to be shown... Did you come to a solution on this matter?

