- Find Answers
- :
- Using Splunk
- :
- Dashboards & Visualizations
- :
- How to create highchart zones that change the colo...
- Subscribe to RSS Feed
- Mark Topic as New
- Mark Topic as Read
- Float this Topic for Current User
- Bookmark Topic
- Subscribe to Topic
- Mute Topic
- Printer Friendly Page
- Mark as New
- Bookmark Message
- Subscribe to Message
- Mute Message
- Subscribe to RSS Feed
- Permalink
- Report Inappropriate Content
Hi Team
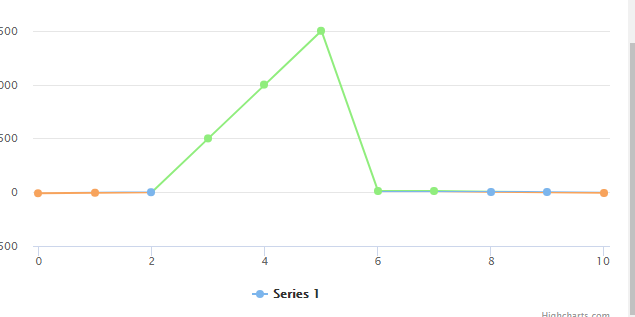
I want to create highcharts zones. I need a chart that changes the color line as the example below
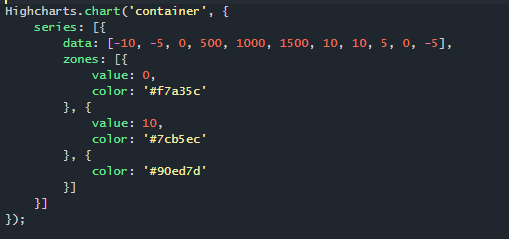
I found that I need to create a js with this code:
But I do not know how to pass the series data based on a Search result. In the example, the data is always the same.
Can someone help me?
Thanks in advance
- Mark as New
- Bookmark Message
- Subscribe to Message
- Mute Message
- Subscribe to RSS Feed
- Permalink
- Report Inappropriate Content
@maridelfi, looking at the Coloring ranges by zone option in Highcharts as explained in your example, seems like it overlaps the last series into next one. One of the options you have in Splunk is to use streamstats command which works with sorted time-series data to get the previous value of a range and use the same in the next range as well.
Try the following Run anywhere search based on your Sample Data.
| gentimes start=-11 span=1d
    | fields starttime
    | eval _time=starttime
    | fields - starttime
    | appendcols
        [| makeresults
        | eval series="Series 1", count="-10,-5,0,500,1000,1500,10,10,5,0,-5"
        | makemv count delim=","
        | mvexpand count
        | table count]
    | eval range=case(count<0,"Severe",count>=0 AND count<10,"Moderate",true(),"Low")
    | table _time range count
    | xyseries _time range count
    | reverse
    | streamstats last(Low) as PrevLow last(Moderate) as PrevModerate last(Severe) as PrevSevere current=f window=1
    | eval Low=case(isnull(Low) AND isnotnull(PrevLow) AND isnotnull(Severe),Severe,isnull(Low) AND isnotnull(PrevLow) AND isnotnull(Moderate),Moderate,true(),Low),Moderate=case(isnull(Moderate) AND isnotnull(PrevModerate) AND isnotnull(Severe),Severe,isnull(Moderate) AND isnotnull(PrevModerate) AND isnotnull(Low),Low,true(),Moderate),Severe=case(isnull(Severe) AND isnotnull(PrevSevere) AND isnotnull(Low),Low,isnull(Severe) AND isnotnull(PrevSevere) AND isnotnull(Moderate),Moderate,true(),Severe)
    |  fields - Prev*
PS:
1) You would also need to use Chart configuration option color Series based on their ranges:
<option name="charting.fieldColors">{"Low":"#90ed7d","Moderate":"#7cb5ec","Severe":"#f7a35c"}</option>
2) The commands from | gentimes till | table count] generate time-series count data as per series in your question. To maintain the sequence I have used time-series data (also to apply streamstats).
3) xyseries command is used to invert the chart axis as per our data presentation requirement.
4) Default options for handling null values in chart i.e. connect null to Zero or fillnull command in SPL and connect null Gaps or filldown command will not suffice the need (hence streamstats has been used as null adjustment is required only to one event)
5) While you can do this through SPL, if you really want to implement Highcharts with Zone colors, you might have to consider either one of the following time consuming options:
a) Build it yourself using Custom Visualization API
b) Request an enhancement to existing Highcharts (Column, Line, Area and Bar Chart) if you have Splunk Entitlement.
Following is the Simple XML code for Run anywhere example as shown in the screenshot:
<dashboard>
  <label>Highcharts with zone Color</label>
  <row>
    <panel>
      <title>Chart Without Zones (Overlapping Ranges)</title>
      <chart>
        <search>
          <query>| gentimes start=-11 span=1d
| fields starttime
| eval _time=starttime
| fields - starttime
| appendcols
    [| makeresults
    | eval series="Series 1", count="-10,-5,0,500,1000,1500,10,10,5,0,-5"
    | makemv count delim=","
    | mvexpand count
    | table count]
| eval range=case(count<0,"Severe",count>=0 AND count<10,"Moderate",true(),"Low")
| table _time range count
| xyseries _time range count
| reverse</query>
          <earliest>-24h@h</earliest>
          <latest>now</latest>
          <sampleRatio>1</sampleRatio>
        </search>
        <option name="charting.axisLabelsX.majorLabelStyle.overflowMode">ellipsisNone</option>
        <option name="charting.axisLabelsX.majorLabelStyle.rotation">0</option>
        <option name="charting.axisTitleX.text">Time Series</option>
        <option name="charting.axisTitleX.visibility">visible</option>
        <option name="charting.axisTitleY.visibility">visible</option>
        <option name="charting.axisTitleY2.visibility">visible</option>
        <option name="charting.axisX.abbreviation">none</option>
        <option name="charting.axisX.scale">linear</option>
        <option name="charting.axisY.abbreviation">none</option>
        <option name="charting.axisY.scale">linear</option>
        <option name="charting.axisY2.abbreviation">none</option>
        <option name="charting.axisY2.enabled">0</option>
        <option name="charting.axisY2.scale">inherit</option>
        <option name="charting.chart">line</option>
        <option name="charting.chart.bubbleMaximumSize">50</option>
        <option name="charting.chart.bubbleMinimumSize">10</option>
        <option name="charting.chart.bubbleSizeBy">area</option>
        <option name="charting.chart.nullValueMode">gaps</option>
        <option name="charting.chart.showDataLabels">none</option>
        <option name="charting.chart.sliceCollapsingThreshold">0.01</option>
        <option name="charting.chart.stackMode">default</option>
        <option name="charting.chart.style">shiny</option>
        <option name="charting.drilldown">none</option>
        <option name="charting.fieldColors">{"Low":"#90ed7d","Moderate":"#7cb5ec","Severe":"#f7a35c"}</option>
        <option name="charting.layout.splitSeries">0</option>
        <option name="charting.layout.splitSeries.allowIndependentYRanges">0</option>
        <option name="charting.legend.labelStyle.overflowMode">ellipsisMiddle</option>
        <option name="charting.legend.mode">standard</option>
        <option name="charting.legend.placement">right</option>
        <option name="charting.lineWidth">2</option>
        <option name="refresh.display">progressbar</option>
        <option name="trellis.enabled">0</option>
        <option name="trellis.scales.shared">1</option>
        <option name="trellis.size">medium</option>
      </chart>
    </panel>
    <panel>
      <title>Chart With Zones (Overlapping Ranges) - Using Streamstats</title>
      <chart>
        <search>
          <query>| gentimes start=-11 span=1d
| fields starttime
| eval _time=starttime
| fields - starttime
| appendcols
    [| makeresults
    | eval series="Series 1", count="-10,-5,0,500,1000,1500,10,10,5,0,-5"
    | makemv count delim=","
    | mvexpand count
    | table count]
| eval range=case(count<0,"Severe",count>=0 AND count<10,"Moderate",true(),"Low")
| table _time range count
| xyseries _time range count
| reverse
| streamstats last(Low) as PrevLow last(Moderate) as PrevModerate last(Severe) as PrevSevere current=f window=1
| eval Low=case(isnull(Low) AND isnotnull(PrevLow) AND isnotnull(Severe),Severe,isnull(Low) AND isnotnull(PrevLow) AND isnotnull(Moderate),Moderate,true(),Low),Moderate=case(isnull(Moderate) AND isnotnull(PrevModerate) AND isnotnull(Severe),Severe,isnull(Moderate) AND isnotnull(PrevModerate) AND isnotnull(Low),Low,true(),Moderate),Severe=case(isnull(Severe) AND isnotnull(PrevSevere) AND isnotnull(Low),Low,isnull(Severe) AND isnotnull(PrevSevere) AND isnotnull(Moderate),Moderate,true(),Severe)
|  fields - Prev*</query>
          <earliest>-24h@h</earliest>
          <latest>now</latest>
          <sampleRatio>1</sampleRatio>
        </search>
        <option name="charting.axisLabelsX.majorLabelStyle.overflowMode">ellipsisNone</option>
        <option name="charting.axisLabelsX.majorLabelStyle.rotation">0</option>
        <option name="charting.axisTitleX.text">Time Series</option>
        <option name="charting.axisTitleX.visibility">visible</option>
        <option name="charting.axisTitleY.visibility">visible</option>
        <option name="charting.axisTitleY2.visibility">visible</option>
        <option name="charting.axisX.abbreviation">none</option>
        <option name="charting.axisX.scale">linear</option>
        <option name="charting.axisY.abbreviation">none</option>
        <option name="charting.axisY.scale">linear</option>
        <option name="charting.axisY2.abbreviation">none</option>
        <option name="charting.axisY2.enabled">0</option>
        <option name="charting.axisY2.scale">inherit</option>
        <option name="charting.chart">line</option>
        <option name="charting.chart.bubbleMaximumSize">50</option>
        <option name="charting.chart.bubbleMinimumSize">10</option>
        <option name="charting.chart.bubbleSizeBy">area</option>
        <option name="charting.chart.nullValueMode">gaps</option>
        <option name="charting.chart.showDataLabels">none</option>
        <option name="charting.chart.sliceCollapsingThreshold">0.01</option>
        <option name="charting.chart.stackMode">default</option>
        <option name="charting.chart.style">shiny</option>
        <option name="charting.drilldown">none</option>
        <option name="charting.fieldColors">{"Low":"#90ed7d","Moderate":"#7cb5ec","Severe":"#f7a35c"}</option>
        <option name="charting.layout.splitSeries">0</option>
        <option name="charting.layout.splitSeries.allowIndependentYRanges">0</option>
        <option name="charting.legend.labelStyle.overflowMode">ellipsisMiddle</option>
        <option name="charting.legend.mode">standard</option>
        <option name="charting.legend.placement">right</option>
        <option name="charting.lineWidth">2</option>
        <option name="trellis.enabled">0</option>
        <option name="trellis.scales.shared">1</option>
        <option name="trellis.size">medium</option>
      </chart>
    </panel>
  </row>
</dashboard>
Please try out and confirm!
PS: If you have used any supporting js library beside highchart.js like highchart-more.js, Custom Visualization API might not get built. Refer to my previous unanswered question on issue I faced with Highcharts supporting JS files (other than basic charts): https://answers.splunk.com/answers/562115/custom-visualization-api-issues-with-chart-types-o.html
| makeresults | eval message= "Happy Splunking!!!"
- Mark as New
- Bookmark Message
- Subscribe to Message
- Mute Message
- Subscribe to RSS Feed
- Permalink
- Report Inappropriate Content
Hi @maridelfi
Glad you found an awesome answer through @niketnilay 🙂 Please don't forget to resolve your question by clicking "Accept" directly below his answer. This will make it easier for other users with a similar requirement to find the answer.
Thanks!
Patrick
- Mark as New
- Bookmark Message
- Subscribe to Message
- Mute Message
- Subscribe to RSS Feed
- Permalink
- Report Inappropriate Content
@maridelfi, looking at the Coloring ranges by zone option in Highcharts as explained in your example, seems like it overlaps the last series into next one. One of the options you have in Splunk is to use streamstats command which works with sorted time-series data to get the previous value of a range and use the same in the next range as well.
Try the following Run anywhere search based on your Sample Data.
| gentimes start=-11 span=1d
    | fields starttime
    | eval _time=starttime
    | fields - starttime
    | appendcols
        [| makeresults
        | eval series="Series 1", count="-10,-5,0,500,1000,1500,10,10,5,0,-5"
        | makemv count delim=","
        | mvexpand count
        | table count]
    | eval range=case(count<0,"Severe",count>=0 AND count<10,"Moderate",true(),"Low")
    | table _time range count
    | xyseries _time range count
    | reverse
    | streamstats last(Low) as PrevLow last(Moderate) as PrevModerate last(Severe) as PrevSevere current=f window=1
    | eval Low=case(isnull(Low) AND isnotnull(PrevLow) AND isnotnull(Severe),Severe,isnull(Low) AND isnotnull(PrevLow) AND isnotnull(Moderate),Moderate,true(),Low),Moderate=case(isnull(Moderate) AND isnotnull(PrevModerate) AND isnotnull(Severe),Severe,isnull(Moderate) AND isnotnull(PrevModerate) AND isnotnull(Low),Low,true(),Moderate),Severe=case(isnull(Severe) AND isnotnull(PrevSevere) AND isnotnull(Low),Low,isnull(Severe) AND isnotnull(PrevSevere) AND isnotnull(Moderate),Moderate,true(),Severe)
    |  fields - Prev*
PS:
1) You would also need to use Chart configuration option color Series based on their ranges:
<option name="charting.fieldColors">{"Low":"#90ed7d","Moderate":"#7cb5ec","Severe":"#f7a35c"}</option>
2) The commands from | gentimes till | table count] generate time-series count data as per series in your question. To maintain the sequence I have used time-series data (also to apply streamstats).
3) xyseries command is used to invert the chart axis as per our data presentation requirement.
4) Default options for handling null values in chart i.e. connect null to Zero or fillnull command in SPL and connect null Gaps or filldown command will not suffice the need (hence streamstats has been used as null adjustment is required only to one event)
5) While you can do this through SPL, if you really want to implement Highcharts with Zone colors, you might have to consider either one of the following time consuming options:
a) Build it yourself using Custom Visualization API
b) Request an enhancement to existing Highcharts (Column, Line, Area and Bar Chart) if you have Splunk Entitlement.
Following is the Simple XML code for Run anywhere example as shown in the screenshot:
<dashboard>
  <label>Highcharts with zone Color</label>
  <row>
    <panel>
      <title>Chart Without Zones (Overlapping Ranges)</title>
      <chart>
        <search>
          <query>| gentimes start=-11 span=1d
| fields starttime
| eval _time=starttime
| fields - starttime
| appendcols
    [| makeresults
    | eval series="Series 1", count="-10,-5,0,500,1000,1500,10,10,5,0,-5"
    | makemv count delim=","
    | mvexpand count
    | table count]
| eval range=case(count<0,"Severe",count>=0 AND count<10,"Moderate",true(),"Low")
| table _time range count
| xyseries _time range count
| reverse</query>
          <earliest>-24h@h</earliest>
          <latest>now</latest>
          <sampleRatio>1</sampleRatio>
        </search>
        <option name="charting.axisLabelsX.majorLabelStyle.overflowMode">ellipsisNone</option>
        <option name="charting.axisLabelsX.majorLabelStyle.rotation">0</option>
        <option name="charting.axisTitleX.text">Time Series</option>
        <option name="charting.axisTitleX.visibility">visible</option>
        <option name="charting.axisTitleY.visibility">visible</option>
        <option name="charting.axisTitleY2.visibility">visible</option>
        <option name="charting.axisX.abbreviation">none</option>
        <option name="charting.axisX.scale">linear</option>
        <option name="charting.axisY.abbreviation">none</option>
        <option name="charting.axisY.scale">linear</option>
        <option name="charting.axisY2.abbreviation">none</option>
        <option name="charting.axisY2.enabled">0</option>
        <option name="charting.axisY2.scale">inherit</option>
        <option name="charting.chart">line</option>
        <option name="charting.chart.bubbleMaximumSize">50</option>
        <option name="charting.chart.bubbleMinimumSize">10</option>
        <option name="charting.chart.bubbleSizeBy">area</option>
        <option name="charting.chart.nullValueMode">gaps</option>
        <option name="charting.chart.showDataLabels">none</option>
        <option name="charting.chart.sliceCollapsingThreshold">0.01</option>
        <option name="charting.chart.stackMode">default</option>
        <option name="charting.chart.style">shiny</option>
        <option name="charting.drilldown">none</option>
        <option name="charting.fieldColors">{"Low":"#90ed7d","Moderate":"#7cb5ec","Severe":"#f7a35c"}</option>
        <option name="charting.layout.splitSeries">0</option>
        <option name="charting.layout.splitSeries.allowIndependentYRanges">0</option>
        <option name="charting.legend.labelStyle.overflowMode">ellipsisMiddle</option>
        <option name="charting.legend.mode">standard</option>
        <option name="charting.legend.placement">right</option>
        <option name="charting.lineWidth">2</option>
        <option name="refresh.display">progressbar</option>
        <option name="trellis.enabled">0</option>
        <option name="trellis.scales.shared">1</option>
        <option name="trellis.size">medium</option>
      </chart>
    </panel>
    <panel>
      <title>Chart With Zones (Overlapping Ranges) - Using Streamstats</title>
      <chart>
        <search>
          <query>| gentimes start=-11 span=1d
| fields starttime
| eval _time=starttime
| fields - starttime
| appendcols
    [| makeresults
    | eval series="Series 1", count="-10,-5,0,500,1000,1500,10,10,5,0,-5"
    | makemv count delim=","
    | mvexpand count
    | table count]
| eval range=case(count<0,"Severe",count>=0 AND count<10,"Moderate",true(),"Low")
| table _time range count
| xyseries _time range count
| reverse
| streamstats last(Low) as PrevLow last(Moderate) as PrevModerate last(Severe) as PrevSevere current=f window=1
| eval Low=case(isnull(Low) AND isnotnull(PrevLow) AND isnotnull(Severe),Severe,isnull(Low) AND isnotnull(PrevLow) AND isnotnull(Moderate),Moderate,true(),Low),Moderate=case(isnull(Moderate) AND isnotnull(PrevModerate) AND isnotnull(Severe),Severe,isnull(Moderate) AND isnotnull(PrevModerate) AND isnotnull(Low),Low,true(),Moderate),Severe=case(isnull(Severe) AND isnotnull(PrevSevere) AND isnotnull(Low),Low,isnull(Severe) AND isnotnull(PrevSevere) AND isnotnull(Moderate),Moderate,true(),Severe)
|  fields - Prev*</query>
          <earliest>-24h@h</earliest>
          <latest>now</latest>
          <sampleRatio>1</sampleRatio>
        </search>
        <option name="charting.axisLabelsX.majorLabelStyle.overflowMode">ellipsisNone</option>
        <option name="charting.axisLabelsX.majorLabelStyle.rotation">0</option>
        <option name="charting.axisTitleX.text">Time Series</option>
        <option name="charting.axisTitleX.visibility">visible</option>
        <option name="charting.axisTitleY.visibility">visible</option>
        <option name="charting.axisTitleY2.visibility">visible</option>
        <option name="charting.axisX.abbreviation">none</option>
        <option name="charting.axisX.scale">linear</option>
        <option name="charting.axisY.abbreviation">none</option>
        <option name="charting.axisY.scale">linear</option>
        <option name="charting.axisY2.abbreviation">none</option>
        <option name="charting.axisY2.enabled">0</option>
        <option name="charting.axisY2.scale">inherit</option>
        <option name="charting.chart">line</option>
        <option name="charting.chart.bubbleMaximumSize">50</option>
        <option name="charting.chart.bubbleMinimumSize">10</option>
        <option name="charting.chart.bubbleSizeBy">area</option>
        <option name="charting.chart.nullValueMode">gaps</option>
        <option name="charting.chart.showDataLabels">none</option>
        <option name="charting.chart.sliceCollapsingThreshold">0.01</option>
        <option name="charting.chart.stackMode">default</option>
        <option name="charting.chart.style">shiny</option>
        <option name="charting.drilldown">none</option>
        <option name="charting.fieldColors">{"Low":"#90ed7d","Moderate":"#7cb5ec","Severe":"#f7a35c"}</option>
        <option name="charting.layout.splitSeries">0</option>
        <option name="charting.layout.splitSeries.allowIndependentYRanges">0</option>
        <option name="charting.legend.labelStyle.overflowMode">ellipsisMiddle</option>
        <option name="charting.legend.mode">standard</option>
        <option name="charting.legend.placement">right</option>
        <option name="charting.lineWidth">2</option>
        <option name="trellis.enabled">0</option>
        <option name="trellis.scales.shared">1</option>
        <option name="trellis.size">medium</option>
      </chart>
    </panel>
  </row>
</dashboard>
Please try out and confirm!
PS: If you have used any supporting js library beside highchart.js like highchart-more.js, Custom Visualization API might not get built. Refer to my previous unanswered question on issue I faced with Highcharts supporting JS files (other than basic charts): https://answers.splunk.com/answers/562115/custom-visualization-api-issues-with-chart-types-o.html
| makeresults | eval message= "Happy Splunking!!!"
- Mark as New
- Bookmark Message
- Subscribe to Message
- Mute Message
- Subscribe to RSS Feed
- Permalink
- Report Inappropriate Content
Been digging into just about every post you have regarding to highcharts the last few days. they've all be very helpful, thanks!
- Mark as New
- Bookmark Message
- Subscribe to Message
- Mute Message
- Subscribe to RSS Feed
- Permalink
- Report Inappropriate Content
wow, you are a genius! works perfectly
Thaks so much for your help and your time 🙂
- Mark as New
- Bookmark Message
- Subscribe to Message
- Mute Message
- Subscribe to RSS Feed
- Permalink
- Report Inappropriate Content
@maridelfi, Thanks. I am glad this worked for you (specially without having to code your own Custom Visualization 😉 ). Do accept the answer and up-vote to mark this question as answered and help others with similar use case in future!
| makeresults | eval message= "Happy Splunking!!!"


