Are you a member of the Splunk Community?
- Find Answers
- :
- Using Splunk
- :
- Dashboards & Visualizations
- :
- How to create a barchart with multiple metrics (in...
- Subscribe to RSS Feed
- Mark Topic as New
- Mark Topic as Read
- Float this Topic for Current User
- Bookmark Topic
- Subscribe to Topic
- Mute Topic
- Printer Friendly Page
- Mark as New
- Bookmark Message
- Subscribe to Message
- Mute Message
- Subscribe to RSS Feed
- Permalink
- Report Inappropriate Content
How to create a barchart with multiple metrics (including trellis)?
I have the following search:
index=felix_emea sourcetype="Felixapps:prod:log" Action = "Resp_VPMG"
| dedup EventIndex
| rex field=Message "^<b>(?<Region>.+)<\/b>"
| rex "Response Codes:\s(?<responseCode>\d{1,3})"
| rex field=Message ":\s(?<errCount>\d{1,4})$"
| FIELDS "Action" "Region" "responseCode" "errCount"
| timechart sum(errCount) by Region
which is returning the following events:
|
Time |
Action |
responseCode |
Region |
errCount |
|
21/11/2022 09:46:07 |
Resp_VPMG |
912 |
VPMG - Wizink PRD-E5 |
14 |
|
21/11/2022 09:16:31 |
Resp_VPMG |
911 |
Moneta IBS via VPMG |
8 |
|
21/11/2022 03:02:07 |
Resp_VPMG |
911 |
Moneta IBS via VPMG |
129 |
|
21/11/2022 02:46:59 |
Resp_VPMG |
911 |
Moneta IBS via VPMG |
92 |
|
20/11/2022 20:31:38 |
Resp_VPMG |
911 |
Moneta IBS via VPMG |
16 |
|
20/11/2022 19:31:36 |
Resp_VPMG |
911 |
Moneta IBS via VPMG |
32 |
|
20/11/2022 02:26:45 |
Resp_VPMG |
911 |
Addiko IBS via VPMG |
7 |
and I can display the results on a bar chart like this:
but I have no visibility of the 'responseCode' field.
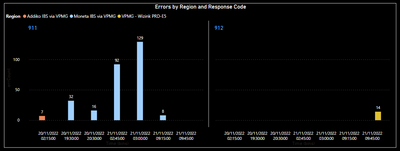
If I copy the data into PowerBI, I can easily get a visualisation like this:
which shows Errors by region and by responseCode (using a PowerBI 'Small Measures', which seems to be the equivalent of Splunk's 'Trellis').
Can I recreate this visualisation in Splunk? Using the Trellis option only allows me to trellis the report by Region and not by responseCode.
Thanks.
Steve
- Mark as New
- Bookmark Message
- Subscribe to Message
- Mute Message
- Subscribe to RSS Feed
- Permalink
- Report Inappropriate Content
. Sorry for the delay in replying.
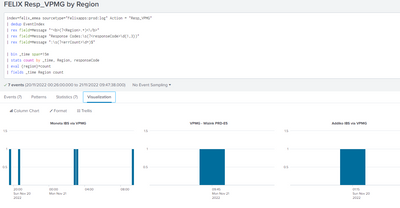
That isn't working. All I get is this:
So yes - there is a separate graph for each region, but the columns are simply the count of {Region}, not a count of different responseCode
I'm not sure what your line graphs are showing - I cant replicate that.
- Mark as New
- Bookmark Message
- Subscribe to Message
- Mute Message
- Subscribe to RSS Feed
- Permalink
- Report Inappropriate Content
@StephenIves - I can see your query very different that what I put in my answer, can you please try to replicate that?
- Mark as New
- Bookmark Message
- Subscribe to Message
- Mute Message
- Subscribe to RSS Feed
- Permalink
- Report Inappropriate Content
Hi Vatsal,
I lost access to this account, so havent been able to reply until now.
This is the query you suggested I try:
index=felix_emea sourcetype="Felixapps:prod:log" Action = "Resp_VPMG"
| dedup EventIndex
| rex field=Message "^<b>(?<Region>.+)<\/b>"
| rex "Response Codes:\s(?<responseCode>\d{1,3})"
| rex field=Message ":\s(?<errCount>\d{1,4})$"

| bin _time span=1h
| stats count by _time, Region responseCode
| eval {Region}=count
| fields - Region, count
I'm not sure what the visualisation is showing me exactly : I can activate a trellis display buy region, but the bars on each graph )when I activate the legend) are labelled as 'responseCode' and the region. All bars are showing as just under 1,000:
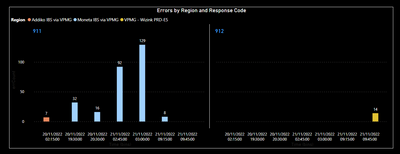
Again, the Power BI display I am trying to replicate is this:
With a timechart of the count of response codes by region, trellised by responsecode.
Here is the sample data for the Power BI report:
Time Action responseCode Region errCount
| 21/11/2022 09:46:07 | Resp_VPMG | 912 | VPMG - Wizink PRD-E5 | 14 |
| 21/11/2022 09:16:31 | Resp_VPMG | 911 | Moneta IBS via VPMG | 8 |
| 21/11/2022 03:02:07 | Resp_VPMG | 911 | Moneta IBS via VPMG | 129 |
| 21/11/2022 02:46:59 | Resp_VPMG | 911 | Moneta IBS via VPMG | 92 |
| 20/11/2022 20:31:38 | Resp_VPMG | 911 | Moneta IBS via VPMG | 16 |
| 20/11/2022 19:31:36 | Resp_VPMG | 911 | Moneta IBS via VPMG | 32 |
| 20/11/2022 02:26:45 | Resp_VPMG | 911 | Addiko IBS via VPMG | 7 |
('Action' is not used).
- Mark as New
- Bookmark Message
- Subscribe to Message
- Mute Message
- Subscribe to RSS Feed
- Permalink
- Report Inappropriate Content
@StephenIves - Try this search query:
index=felix_emea sourcetype="Felixapps:prod:log" Action = "Resp_VPMG"
| dedup EventIndex
| rex field=Message "^<b>(?<Region>.+)<\/b>"
| rex "Response Codes:\s(?<responseCode>\d{1,3})"
| rex field=Message ":\s(?<errCount>\d{1,4})$"

| bin _time span=1h
| stats count by _time, Region responseCode
| eval {Region}=count
| fields - Region, count
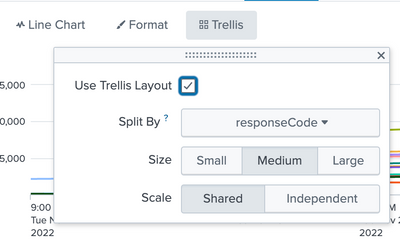
And this trellis configuration:
Here is my sample search:
index=_internal
| rename log_level as responseCode, host as Region
| bin _time span=1h
| stats count by _time, Region responseCode
| eval {Region}=count
| fields - Region, count
hope this helps!!! Upvote and accept the answer if it does!!


