- Find Answers
- :
- Using Splunk
- :
- Dashboards & Visualizations
- :
- How to add customized color to a chart in dashboar...
- Subscribe to RSS Feed
- Mark Topic as New
- Mark Topic as Read
- Float this Topic for Current User
- Bookmark Topic
- Subscribe to Topic
- Mute Topic
- Printer Friendly Page
- Mark as New
- Bookmark Message
- Subscribe to Message
- Mute Message
- Subscribe to RSS Feed
- Permalink
- Report Inappropriate Content
Hi All,
I am struggling to add customized colours to the chart panel in the dashboard.
Can any one please help on this.
My dashborad panel query:
<panel>
<chart>
<title> Response times more than 1000 ms by codes</title>
<search>
<query> index=avf-res-app code=all* OR code =ma21rt source=*application* |eval ipl=code+"_"+host_ip
|stats avg(responseTime) as Avg_Rep by ipl, code |sort by Avg_Rep desc |where Avg_Rep > 1000 |eval Avg_Rep = round(Avg_Rep, 2)</query>
<earliest>-1d@d</earliest>
<latest>now</latest>
</search>
<option name="charting.axisTitleX.visibility">collapsed</option>
<option name="charting.axisTitleY.visibility">collapsed</option>
<option name="charting.axisTitleY2.visibility">collapsed</option>
<option name="charting.axisX.scale">linear</option>
<option name="charting.axisY.scale">linear</option>
<option name="charting.axisY.abbreviation">auto</option>
<option name="charting.chart">column</option>
<option name="charting.chart.showDataLabels">all</option>
<option name="charting.chart.stackMode">default</option>
<option name="charting.chart.style">shiny</option>
<option name="charting.drilldown">all</option>
<option name="charting.layout.splitSeries">1</option>
<option name="charting.layout.splitSeries.allIndeoendentYRanges">1</option>
<option name="charting.legend.placement">none</option>
<option name="referesh.display">progressbar</option>
<option name="trellis.enabled">1</option>
<option name="trellis.splitBy">code</option>
<option name="trellis.scales.shared">1</option>
<option name="trellis.size">medium</option>
<option name="charting.chart.columnSpacing">35<option>
panel image:
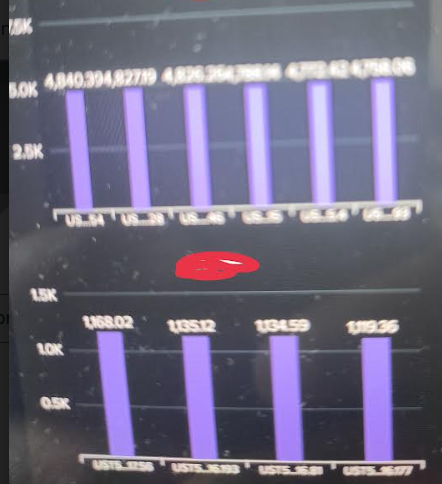
here as shown in the image there are multiple codes are displaying, i want to display each one in different colours.
- Mark as New
- Bookmark Message
- Subscribe to Message
- Mute Message
- Subscribe to RSS Feed
- Permalink
- Report Inappropriate Content
Hi @Harish2
field clours apply only to filed names, not the vlaues inside it,
in this case you need to apply clour for each code value, need to modify query to get that,
index=avf-res-app code=all* OR code =ma21rt source=*application* |eval ipl=code+"_"+host_ip
| eval CodeA =case(code="codeA","CodeA")
| eval CodeB =case(code="codeA","CodeB")
|stats avg(responseTime) as Avg_Rep , by ipl, CodeA CodeB |sort by Avg_Rep desc |where Avg_Rep > 1000 |eval Avg_Rep = round(Avg_Rep, 2)
add below line in XML
<option name="charting.fieldColors">{"CodeA ":0x65A637, "CodeB ":0xFFBF00}</option>

