Are you a member of the Splunk Community?
- Find Answers
- :
- Using Splunk
- :
- Dashboards & Visualizations
- :
- How to add background colour to single value visua...
- Subscribe to RSS Feed
- Mark Topic as New
- Mark Topic as Read
- Float this Topic for Current User
- Bookmark Topic
- Subscribe to Topic
- Mute Topic
- Printer Friendly Page
- Mark as New
- Bookmark Message
- Subscribe to Message
- Mute Message
- Subscribe to RSS Feed
- Permalink
- Report Inappropriate Content
Hi all, I have just started using Splunk dashboards to visualise my data, sorry for asking such a simple question. I have added single value panel on my dashboard which shows the verdict of the test performed. I am using the following the source code:
```
<row>
<panel>
<single>
<title>Verdict</title>
<search>
<query>index=test_index
| search splunk_id="$splunk_id$"
| table verdict
</query>
</search>
<option name="colorMode">block</option>
<option name="drilldown">none</option>
<option name="height">60</option>
<option name="rangeColors">["0x53a051","0x0877a6","0xf8be34","0xf1813f","0xdc4e41"]</option>
<option name="useColors">1</option>
</single>
</panel>
</row>
```
It creates a panel with black background colour with text in white colour at the centre. So verdict will give only 2 values ('Pass' or 'Fail'). What I want is the panel should have green background colour is verdict is 'Pass' and red colour background if verdict is 'Fail'. Along with this I would like to have 'Pass' and 'Fail' written in black colour rather than white colour.
I am not the admin of the Splunk server so I cant add and javascript file or css file to the source code.
Any help would be hugely appreciated. Thanks!
@bowesmana can you help me out here if you can? Thanks!
- Mark as New
- Bookmark Message
- Subscribe to Message
- Mute Message
- Subscribe to RSS Feed
- Permalink
- Report Inappropriate Content
You can use either of these two methods - the first panel uses CSS to control the colours for the foreground (text) and block background. The search sets tokens based on the value of the verdict.
The second panel uses the additional 'range' field to define range as low or severe depending on the verdict value.
<form>
  <label>tst</label>
  <row>
    <panel depends="$hide_css$">
      <html>
        <style>
          #verdict rect {
            fill: $verdict_background$ !important;
          }
          #verdict text {
            fill: $verdict_foreground$ !important;
          }
        </style>
      </html>
    </panel>
    <panel>
      <single id="verdict">
        <title>Verdict</title>
        <search>
          <query>| makeresults
          | eval verdict=mvindex(split("Pass,Fail",","), random() % 2)
          </query>
          <done>
            <eval token="verdict_background">if($result.verdict$="Pass", "green", "red")</eval>
            <set token="verdict_foreground">black</set>
          </done>
        </search>
        <option name="colorMode">block</option>
        <option name="drilldown">none</option>
        <option name="height">60</option>
        <option name="rangeColors">["0x53a051","0xdc4e41"]</option>
        <option name="rangeValues">[0]</option>
        <option name="useColors">1</option>
      </single>
    </panel>
    <panel>
      <single>
        <title>Verdict 2</title>
        <search>
          <query>| makeresults
          | eval verdict=mvindex(split("Pass,Fail",","), random() % 2)
          | eval range=if(verdict=="Pass", "low", "severe")
          | table verdict range
          </query>
        </search>
        <option name="colorMode">block</option>
        <option name="drilldown">none</option>
        <option name="height">60</option>
        <option name="field">verdict</option>
      </single>
    </panel>
  </row>
</form>
- Mark as New
- Bookmark Message
- Subscribe to Message
- Mute Message
- Subscribe to RSS Feed
- Permalink
- Report Inappropriate Content
Just 1 pie chart related question @bowesmana , asking it here just for ease of use.
I have a piechart created by following code:
```
<panel>
<chart>
<search>
<query>
index=test_index
| search splunk_id="$splunk_id$"
| table campaign_data.All.total_passed campaign_data.All.total_failed campaign_data.All.total_not_run
| rename campaign_data.All.total_passed as "Passed" campaign_data.All.total_failed as "Failed" campaign_data.All.total_not_run as "Not Run"
| eval name="No of Tests"
| transpose 0 header_field=name
</query>
</search>
<option name="charting.chart">pie</option>
<option name="charting.drilldown">none</option>
<option name="charting.fieldColors">{"Failed": 0xFF0000, "Not Run": 0x808080, "Passed":0x009900, "NULL":0xC4C4C0}</option>
<option name="refresh.display">progressbar</option>
</chart>
</panel>
```
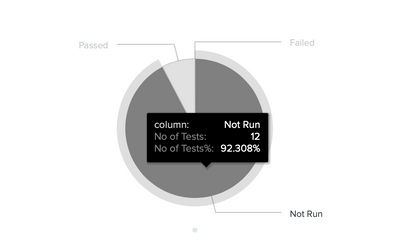
it gives the following output:
When 1 hover over a part it shows 3 rows of data. What I want is in the 3rd row, the percentage should be cutoff by 2 decimal pts. Also can we change the label "No of tests%" to "Percentage" but keep 2nd row data value as it is? Is it possible? Thanks!
- Mark as New
- Bookmark Message
- Subscribe to Message
- Mute Message
- Subscribe to RSS Feed
- Permalink
- Report Inappropriate Content
It worked @bowesmana. Thanks a lot!
- Mark as New
- Bookmark Message
- Subscribe to Message
- Mute Message
- Subscribe to RSS Feed
- Permalink
- Report Inappropriate Content
You can use either of these two methods - the first panel uses CSS to control the colours for the foreground (text) and block background. The search sets tokens based on the value of the verdict.
The second panel uses the additional 'range' field to define range as low or severe depending on the verdict value.
<form>
  <label>tst</label>
  <row>
    <panel depends="$hide_css$">
      <html>
        <style>
          #verdict rect {
            fill: $verdict_background$ !important;
          }
          #verdict text {
            fill: $verdict_foreground$ !important;
          }
        </style>
      </html>
    </panel>
    <panel>
      <single id="verdict">
        <title>Verdict</title>
        <search>
          <query>| makeresults
          | eval verdict=mvindex(split("Pass,Fail",","), random() % 2)
          </query>
          <done>
            <eval token="verdict_background">if($result.verdict$="Pass", "green", "red")</eval>
            <set token="verdict_foreground">black</set>
          </done>
        </search>
        <option name="colorMode">block</option>
        <option name="drilldown">none</option>
        <option name="height">60</option>
        <option name="rangeColors">["0x53a051","0xdc4e41"]</option>
        <option name="rangeValues">[0]</option>
        <option name="useColors">1</option>
      </single>
    </panel>
    <panel>
      <single>
        <title>Verdict 2</title>
        <search>
          <query>| makeresults
          | eval verdict=mvindex(split("Pass,Fail",","), random() % 2)
          | eval range=if(verdict=="Pass", "low", "severe")
          | table verdict range
          </query>
        </search>
        <option name="colorMode">block</option>
        <option name="drilldown">none</option>
        <option name="height">60</option>
        <option name="field">verdict</option>
      </single>
    </panel>
  </row>
</form>

