- Find Answers
- :
- Using Splunk
- :
- Dashboards & Visualizations
- :
- How to add a time input to a form - missing search...
- Subscribe to RSS Feed
- Mark Topic as New
- Mark Topic as Read
- Float this Topic for Current User
- Bookmark Topic
- Subscribe to Topic
- Mute Topic
- Printer Friendly Page
- Mark as New
- Bookmark Message
- Subscribe to Message
- Mute Message
- Subscribe to RSS Feed
- Permalink
- Report Inappropriate Content
How to add a time input to a form - missing search editing icon
I would like to let users of my dashboard pick the time frame the reports in the panels search. The answer appears to be here:
https://docs.splunk.com/Documentation/Splunk/7.0.1/Viz/FormEditor
under Add a time input to a form
I have added the time input:
The next part sounds clear:
5.a. Click the search editing icon.
b. Select Edit search.
c. For Time Range Scope select Shared Time Picker.
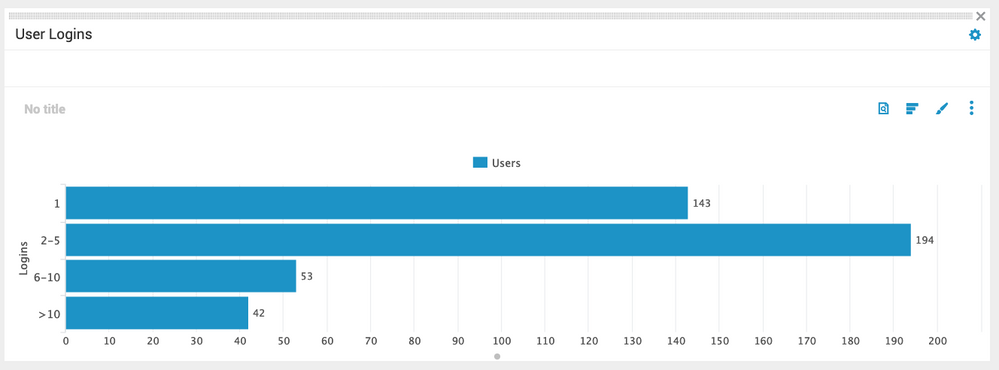
The problem is I don't seem to have the "search editing icon" so I can't edit the search in the dashboard. Here's a snapshot of a panel in my dashboard:
None of the icons are the search editing one. They are: View Report, Select Visualization, Format Visualization and More Actions. I have dug into them and none seem to have what I need.
Any suggestions out there?
Thanks,
Joshua
- Mark as New
- Bookmark Message
- Subscribe to Message
- Mute Message
- Subscribe to RSS Feed
- Permalink
- Report Inappropriate Content
If you click on the icon for "View report", it will open up a popup that has links at the bottom, one labeled "Open in Search". Clicking on that will bring you to the panel query, and you can change the time input on the right hand side drop-down. Once you select a new time range, the "Save" button will appear, and when you click on that you'll get a popup that allows you to say Yes or No to the Time Range Picker and save that.
- Mark as New
- Bookmark Message
- Subscribe to Message
- Mute Message
- Subscribe to RSS Feed
- Permalink
- Report Inappropriate Content
That does get a another date range, but I'd like to enable the time-range picker on the dashboard rather than opening each individual search in another window.
- Mark as New
- Bookmark Message
- Subscribe to Message
- Mute Message
- Subscribe to RSS Feed
- Permalink
- Report Inappropriate Content
@jrfreeze When you click on the DAshboard EDIT , you see 2 buttons at Edit Dashboard-> UI and Source. From Source you can edit the code of your dashboard.


