Join the Conversation
- Find Answers
- :
- Using Splunk
- :
- Dashboards & Visualizations
- :
- Re: How can I format a chart to show values cleanl...
- Subscribe to RSS Feed
- Mark Topic as New
- Mark Topic as Read
- Float this Topic for Current User
- Bookmark Topic
- Subscribe to Topic
- Mute Topic
- Printer Friendly Page
- Mark as New
- Bookmark Message
- Subscribe to Message
- Mute Message
- Subscribe to RSS Feed
- Permalink
- Report Inappropriate Content
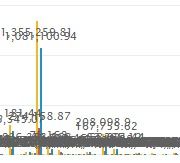
My chart has a lot of columns, so the values overlap each other.
I need configure a shortcut that I can use when I want to display the data labels values.
For example, display the labels only when I zoom in, so the labels will not overlap.
Anyone know if there's a solution available for this?
Thanks.
Regards, Matheus.
- Mark as New
- Bookmark Message
- Subscribe to Message
- Mute Message
- Subscribe to RSS Feed
- Permalink
- Report Inappropriate Content
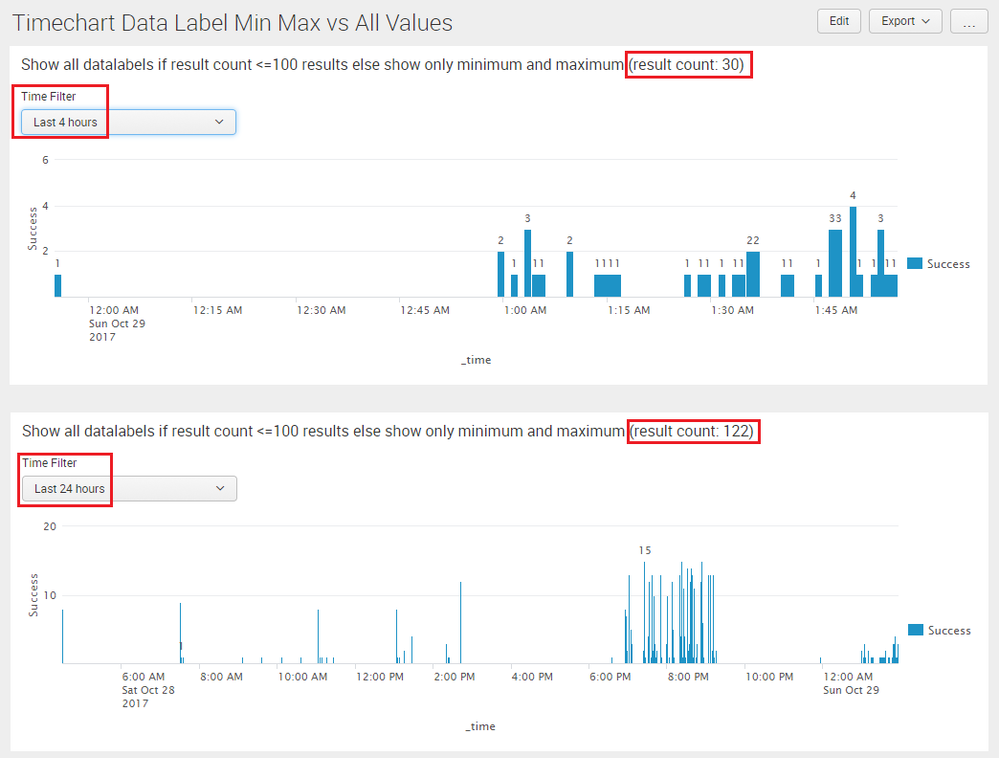
@matheusaatag, you can pass a token to Simple XML Chart Configuration charting.chart.showDataLabels and switch the token between minmax and all as per number of results being displayed in the chart.
<option name="charting.chart.showDataLabels">$dataLabelOption$</option>
Please find attached below a Run Anywhere Search where all data labels are displayed only if number results is 100 or less, or else it switches to minmax. This example uses Time Picker to run the required search and set Data Label Option required as per number of results. This logic can also be adjusted for:
1) Toggle Data Label Option based on Time Range (lets say <60 min implies all label etc)
2) Chart Selection which will require a separate chart to be drawn on selection.
<form>
  <label>Timechart Data Label Min Max vs All Values</label>
  <fieldset submitButton="false"></fieldset>
  <row>
    <panel>
      <title>Show all datalabels if result count <=100 results else show only minimum and maximum (result count: $tokResultCount$)</title>
      <input type="time" token="tokTime" searchWhenChanged="true">
        <label>Time Filter</label>
        <default>
          <earliest>-24h@h</earliest>
          <latest>now</latest>
        </default>
      </input>
      <chart>
        <search>
          <query>index="_internal" sourcetype="splunkd" log_level!="INFO"
      |  timechart span=1m count as Success cont=f</query>
          <earliest>$tokTime.earliest$</earliest>
          <latest>$tokTime.latest$</latest>
          <done>
            <condition match="$job.resultCount$<=100">
              <set token="dataLabelOption">all</set>
              <set token="tokResultCount">$job.resultCount$</set>
            </condition>
            <condition>
              <set token="dataLabelOption">minmax</set>
              <set token="tokResultCount">$job.resultCount$</set>
            </condition>
          </done>
        </search>
        <option name="charting.chart">column</option>
        <option name="charting.chart.showDataLabels">$dataLabelOption$</option>
        <option name="charting.drilldown">none</option>
        <option name="refresh.display">progressbar</option>
      </chart>
    </panel>
  </row>
</form>
Please try out and confirm.
| makeresults | eval message= "Happy Splunking!!!"
- Mark as New
- Bookmark Message
- Subscribe to Message
- Mute Message
- Subscribe to RSS Feed
- Permalink
- Report Inappropriate Content
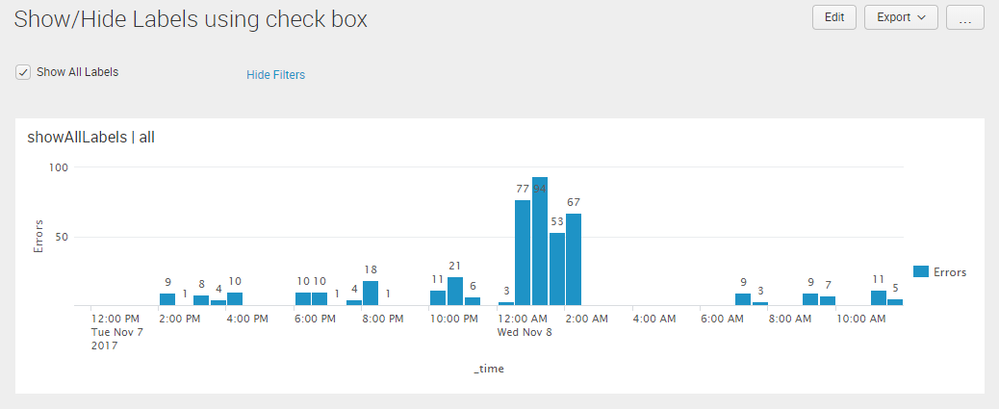
@matheusaatag, I thought you wanted solution to be automatic based on timeline selection. If you want to put in an input to toggle between all and minmax data labels (or even none data label option), you can definitely do it.
Please find below run anywhere dashboard using a checkbox to do the same (you can use a radio button if you have to toggle between all three options):
<form>
<label>Show/Hide Labels using check box</label>
<fieldset submitButton="false">
<input type="checkbox" token="showChartLabels">
<label></label>
<choice value="showAllLabels">Show All Labels</choice>
<change>
<condition match="$showChartLabels$=="showAllLabels"">
<set token="tokShowChartLabels">all</set>
</condition>
<condition>
<set token="tokShowChartLabels">minmax</set>
</condition>
</change>
</input>
</fieldset>
<row>
<panel>
<title>$showChartLabels$ | $tokShowChartLabels$</title>
<chart>
<search>
<query>index=_internal sourcetype=splunkd log_level!="INFO"
| timechart count as Errors</query>
<earliest>-24h@h</earliest>
<latest>now</latest>
</search>
<option name="charting.chart">column</option>
<option name="charting.chart.showDataLabels">$tokShowChartLabels$</option>
<option name="charting.drilldown">none</option>
</chart>
</panel>
</row>
</form>
Please try out and confirm.
| makeresults | eval message= "Happy Splunking!!!"
- Mark as New
- Bookmark Message
- Subscribe to Message
- Mute Message
- Subscribe to RSS Feed
- Permalink
- Report Inappropriate Content
is it possible to show data label values only for the selected particular legend and not for all?
Current values of charting.chart.showDataLabels is all, min/max and none. can we use any token to show only data label values for only selected legend and how?
- Mark as New
- Bookmark Message
- Subscribe to Message
- Mute Message
- Subscribe to RSS Feed
- Permalink
- Report Inappropriate Content
@Chinmai, since your query is slightly different from the original issue posted here, I have answered your new question posted at https://answers.splunk.com/answers/659704/how-to-avoid-overlapping-of-data-label-values-in-a.html. Please try out and confirm!
If you found this answer/topic useful, do up-vote the same 🙂
| makeresults | eval message= "Happy Splunking!!!"
- Mark as New
- Bookmark Message
- Subscribe to Message
- Mute Message
- Subscribe to RSS Feed
- Permalink
- Report Inappropriate Content
@matheusaatag, you can pass a token to Simple XML Chart Configuration charting.chart.showDataLabels and switch the token between minmax and all as per number of results being displayed in the chart.
<option name="charting.chart.showDataLabels">$dataLabelOption$</option>
Please find attached below a Run Anywhere Search where all data labels are displayed only if number results is 100 or less, or else it switches to minmax. This example uses Time Picker to run the required search and set Data Label Option required as per number of results. This logic can also be adjusted for:
1) Toggle Data Label Option based on Time Range (lets say <60 min implies all label etc)
2) Chart Selection which will require a separate chart to be drawn on selection.
<form>
  <label>Timechart Data Label Min Max vs All Values</label>
  <fieldset submitButton="false"></fieldset>
  <row>
    <panel>
      <title>Show all datalabels if result count <=100 results else show only minimum and maximum (result count: $tokResultCount$)</title>
      <input type="time" token="tokTime" searchWhenChanged="true">
        <label>Time Filter</label>
        <default>
          <earliest>-24h@h</earliest>
          <latest>now</latest>
        </default>
      </input>
      <chart>
        <search>
          <query>index="_internal" sourcetype="splunkd" log_level!="INFO"
      |  timechart span=1m count as Success cont=f</query>
          <earliest>$tokTime.earliest$</earliest>
          <latest>$tokTime.latest$</latest>
          <done>
            <condition match="$job.resultCount$<=100">
              <set token="dataLabelOption">all</set>
              <set token="tokResultCount">$job.resultCount$</set>
            </condition>
            <condition>
              <set token="dataLabelOption">minmax</set>
              <set token="tokResultCount">$job.resultCount$</set>
            </condition>
          </done>
        </search>
        <option name="charting.chart">column</option>
        <option name="charting.chart.showDataLabels">$dataLabelOption$</option>
        <option name="charting.drilldown">none</option>
        <option name="refresh.display">progressbar</option>
      </chart>
    </panel>
  </row>
</form>
Please try out and confirm.
| makeresults | eval message= "Happy Splunking!!!"
- Mark as New
- Bookmark Message
- Subscribe to Message
- Mute Message
- Subscribe to RSS Feed
- Permalink
- Report Inappropriate Content
@matheusaatag, were you able to test out the solution provided? Please check and confirm!
| makeresults | eval message= "Happy Splunking!!!"
- Mark as New
- Bookmark Message
- Subscribe to Message
- Mute Message
- Subscribe to RSS Feed
- Permalink
- Report Inappropriate Content
Hi @niketnilay ,
It is an alternative and I'm going to use it, looks likes it works well. 🙂
But I was thinks in something where I can turn on/off the value labels in realtime on Splunk Charts, but I guess its not possible yet.
Thank you.
Regards, Matheus Vinícius


