Join the Conversation
- Find Answers
- :
- Using Splunk
- :
- Dashboards & Visualizations
- :
- Re: How can I display data in a bar graph for 3 we...
- Subscribe to RSS Feed
- Mark Topic as New
- Mark Topic as Read
- Float this Topic for Current User
- Bookmark Topic
- Subscribe to Topic
- Mute Topic
- Printer Friendly Page
- Mark as New
- Bookmark Message
- Subscribe to Message
- Mute Message
- Subscribe to RSS Feed
- Permalink
- Report Inappropriate Content
How can I display data in a bar graph for 3 weeks?
Hi,
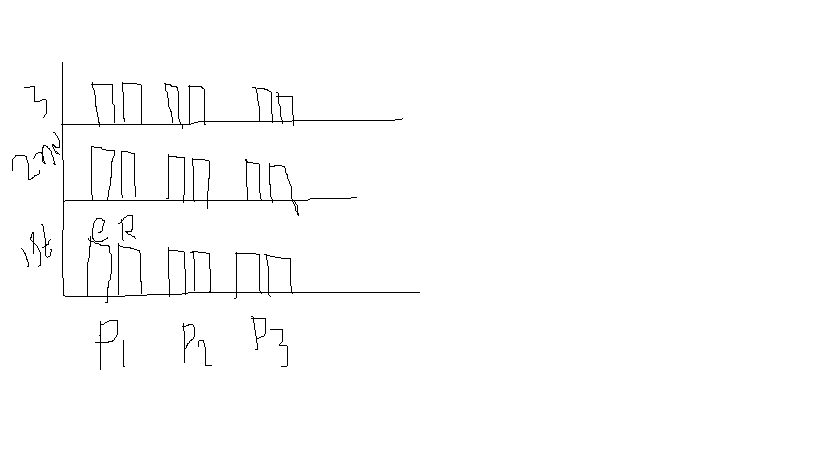
I need to display data person wise for 3 weeks in a bar chart. Please find the attached required dashboard image for a better understanding.
My Query is:
index="os" sourcetype="Service" CaseNumber=* status=* assignment=* |dedup _time,CaseNumber,assignment |streamstats current=f last(assignment) as lg, last(active) as Active by CaseNumber|lookup L1Team.csv SS as assigned_to OUTPUT TeamName| eval is_escalated= if(assignment!=lg AND assignment_group="Susta",1,NULL) |eval is_resolved=if(assignment="Susta" AND status="Complete" AND (isnull(Active) OR Active="true"),1,NULL) | stats count(is_escalated) AS "Escalated Cases" count(is_resolved) AS "Resolved Cases" by assigned_to,TeamName| fields - TeamName
How do you make a dashboard in that way?
- Mark as New
- Bookmark Message
- Subscribe to Message
- Mute Message
- Subscribe to RSS Feed
- Permalink
- Report Inappropriate Content
- Mark as New
- Bookmark Message
- Subscribe to Message
- Mute Message
- Subscribe to RSS Feed
- Permalink
- Report Inappropriate Content
Try this
index="os" sourcetype="Service" CaseNumber= status= assignment=* |dedup _time,CaseNumber,assignment |streamstats current=f last(assignment) as lg, last(active) as Active by CaseNumber|lookup L1Team.csv SS as assigned_to OUTPUT TeamName| eval is_escalated= if(assignment!=lg AND assignment_group="Susta",1,NULL) |eval is_resolved=if(assignment="Susta" AND status="Complete" AND (isnull(Active) OR Active="true"),1,NULL) | bin span=1w _time|stats count(is_escalated) AS "Escalated Cases" count(is_resolved) AS "Resolved Cases" by assigned_to,TeamName,_time| fields - TeamName
- Mark as New
- Bookmark Message
- Subscribe to Message
- Mute Message
- Subscribe to RSS Feed
- Permalink
- Report Inappropriate Content
But it will display for 1 weak data right. I want to display data for 3 weaks like I send in image.i want dashboard should display like that in image.how can create that dashboard like that
- Mark as New
- Bookmark Message
- Subscribe to Message
- Mute Message
- Subscribe to RSS Feed
- Permalink
- Report Inappropriate Content
you need to use your earliest time as -3w and latest time as now,it will give you each weeks data for that time span.
- Mark as New
- Bookmark Message
- Subscribe to Message
- Mute Message
- Subscribe to RSS Feed
- Permalink
- Report Inappropriate Content
index="os" sourcetype="Service" CaseNumber= status= assignment=* |dedup _time,CaseNumber,assignment |streamstats current=f last(assignment) as lg, last(active) as Active by CaseNumber|lookup L1Team.csv SS as assigned_to OUTPUT TeamName| eval is_escalated= if(assignment!=lg AND assignment_group="Susta",1,NULL) |eval is_resolved=if(assignment="Susta" AND status="Complete" AND (isnull(Active) OR Active="true"),1,NULL) | bin span=1w _time|stats count(is_escalated) AS "Escalated Cases" count(is_resolved) AS "Resolved Cases" by assigned_to,TeamName,_time| fields - TeamName
I need to create timechart for this.When i give timechart for this query it is not displaying correctly.Please help how to for this with timechart


