Turn on suggestions
Auto-suggest helps you quickly narrow down your search results by suggesting possible matches as you type.
Dashboards & Visualizations
×
Are you a member of the Splunk Community?
Sign in or Register with your Splunk account to get your questions answered, access valuable resources and connect with experts!
Turn on suggestions
Auto-suggest helps you quickly narrow down your search results by suggesting possible matches as you type.
- Find Answers
- :
- Using Splunk
- :
- Dashboards & Visualizations
- :
- Has anyone created Isopleth or Contour Graphs in S...
Options
- Subscribe to RSS Feed
- Mark Topic as New
- Mark Topic as Read
- Float this Topic for Current User
- Bookmark Topic
- Subscribe to Topic
- Mute Topic
- Printer Friendly Page
- Mark as New
- Bookmark Message
- Subscribe to Message
- Mute Message
- Subscribe to RSS Feed
- Permalink
- Report Inappropriate Content
Has anyone created Isopleth or Contour Graphs in Splunk? Is it possible?
hvandenb
Path Finder
09-19-2014
11:38 AM
We have a need to create these type of graphs similar to the image listed below. There seems to be some D3 contour plugin that could help. So my question is has anyone created these type of graphs in Splunk before?!
Here is my desired result Water Temp
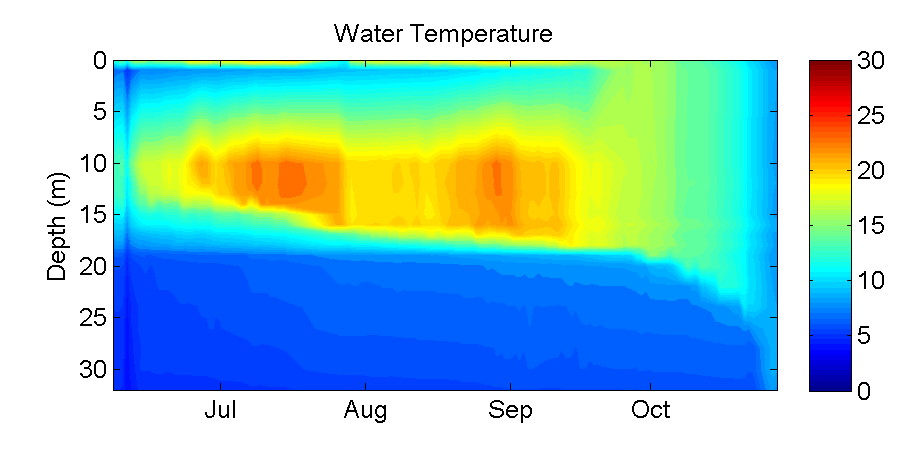
- Mark as New
- Bookmark Message
- Subscribe to Message
- Mute Message
- Subscribe to RSS Feed
- Permalink
- Report Inappropriate Content
ChrisG

Splunk Employee
09-19-2014
03:18 PM
I have not done it, but I know you can use the web framework to add a D3 visualization, have you investigated that? http://dev.splunk.com/view/webframework-splunkjsstack/SP-CAAAEN6.
- Mark as New
- Bookmark Message
- Subscribe to Message
- Mute Message
- Subscribe to RSS Feed
- Permalink
- Report Inappropriate Content
hvandenb
Path Finder
09-19-2014
03:59 PM
Chris -
I have looked at the framework and integrating D3, however, I was hoping someone has an example using this specific type of graph.
Get Updates on the Splunk Community!
Splunk Decoded: Service Maps vs Service Analyzer Tree View vs Flow Maps
It’s Monday morning, and your phone is buzzing with alert escalations – your customer-facing portal is running ...
What’s New in Splunk Observability – September 2025
What's NewWe are excited to announce the latest enhancements to Splunk Observability, designed to help ITOps ...
Fun with Regular Expression - multiples of nine
Fun with Regular Expression - multiples of nineThis challenge was first posted on Slack #regex channel ...
