- Find Answers
- :
- Using Splunk
- :
- Dashboards & Visualizations
- :
- First transpose. Then colorPalette.
- Subscribe to RSS Feed
- Mark Topic as New
- Mark Topic as Read
- Float this Topic for Current User
- Bookmark Topic
- Subscribe to Topic
- Mute Topic
- Printer Friendly Page
- Mark as New
- Bookmark Message
- Subscribe to Message
- Mute Message
- Subscribe to RSS Feed
- Permalink
- Report Inappropriate Content
First transpose. Then colorPalette.
Hello,
Here is my dashboard before using the transpose command
index=oit_printer_monitoring AND type=Printer
| eval timeConvDate=strftime(_time,"%a %m-%d-%Y")
| eval timeConvTime=strftime(_time,"%H:%M:%S")
| table printer, status, timeConvDate, timeConvTime
| dedup printer
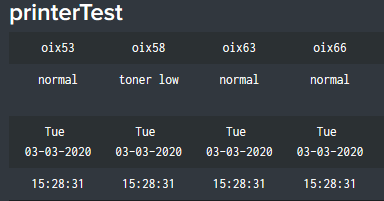
Here is my dashboard After using the transpose command.

index=oit_printer_monitoring AND type=Printer
| eval timeConvDate=strftime(_time,"%a %m-%d-%Y")
| eval timeConvTime=strftime(_time,"%H:%M:%S")
| table printer, status, timeConvDate, timeConvTime
| dedup printer
| transpose 0
Here is my colorPalette for both.
        <format type="color" field="status">
          <colorPalette type="map">{"toner low":#EC9960,"normal":#4FA484}</colorPalette>
        </format>
1) How do I make those cells colored pre-transpose remain post-transpose?
2) In the post-transpose dashboard, how would I color the entire column? Printer oix53 status=normal; therefore, oix53 should have a green background. As should Tue 03-03-2020 and 15:28:31. Whereas printer oix58 status=toner low; therefore, oix58, Tue 03-03-2020 and 15:28:31 should have an orange background.
UPDATE
Another issue with using transpose.
It appears that field names either no longer exist; or, there are renamed (columns to rows?) and I cannot find the correct ones. I think figuring out the new(?) field names will resolve the above issue, as well as the new issue below.
Meanwhile, here is the new issue with transpose.
Using this drill down code in the post transpose works. However, it does not work in the post transpose code. Why?
        <drilldown>
          <link target="_blank">/app/search/printertest2?form.printer=$row.printer$</link>
        </drilldown>
Thanks and God bless,
Genesius
- Mark as New
- Bookmark Message
- Subscribe to Message
- Mute Message
- Subscribe to RSS Feed
- Permalink
- Report Inappropriate Content
I would start with tweaking your SPL like this:
| makeresults
| eval index=oit_printer_monitoring, type=Printer
| eval printer="oix58 oax2 oix20 oix25"
| makemv printer
| mvexpand printer
| eval status = case(
    printer=="oix58" OR printer=="oix20", "toner low",
    printer=="oax2" OR printer=="oix25", "normal",
    true(), "ERROR")
| streamstats count AS _serial
| eval _time = _time - 123 * (_serial)

| rename COMMENT AS "Everything above generates sample event data; everything below is your solution"

| dedup printer
| eval timeConvDate=strftime(_time,"%a %m-%d-%Y")
| eval timeConvTime=strftime(_time,"%H:%M:%S")
| table printer, status, timeConvDate, timeConvTime
| eval name="temp"
| multireport
[ chart first(status) AS status BY name printer | eval name = "status" ]
[ chart first(timeConvDate) AS timeConvDate BY name printer | eval name="timeConvDate" ]
[ chart first(timeConvTime) AS timeConvTime BY name printer | eval name="timeConvTime" ]
| fields - printer status timeConvDate timeConvTime
| rename name AS printer
| table printer *
Stay in your search window for now and click on the paint brush icon on each o* header fields. Select Color -> Values -> Define rules. Add two Cell value is colors: one for normal and one for toner low. DO NOT switch to the visualization tab; just do Save as with Dashboard panel. Done.
- Mark as New
- Bookmark Message
- Subscribe to Message
- Mute Message
- Subscribe to RSS Feed
- Permalink
- Report Inappropriate Content
@woodcock
Thanks for the response. I apologize if I am not following you.
Your eval printer command references only the 4 printers I had in my screenshot. That was only a sample. There are over 70, and we want to make this future-proof. We should not have to modify the XML when new printers are deployed.
I know the top section of code is only to generate sample event data, but what does this code do? | streamstats count AS _serial | eval _time = _time - 123 * (_serial)
I didn't realize the table command could be used more than once in a search unless an append or subsearch was used.
Not at all familiar with the multireport command, and could not find on the Splunk Command Quick Reference
If it was only these 4 printers and 2 different status values, using the paintbrush to assign coloring rules would be the way to go. But we have over 70 printers and over 20 status'.
Noticed the original fields of status, timeConvDate, timeConvTime don't exist after the multireport command. We removed | fields - printer status timeConvDate timeConvTime, however, because the SPL is not generating events, these fields are not accessible. If they were, we wanted to test this code | eval printerResult=mvzip(printer,mvzip(status,mvzip(timeConvDate,timeConvTime," ")," ")," ") | makemv delim=" " printerResult to see if we could produce the desired results: concatenate the four fields, and add a newline between the fields to produce this per cell. From there we could apply the formatting.
printer
status
date
time
When using the transpose command is there any way to reference the above?
Thanks and God bless,
Genesius
- Mark as New
- Bookmark Message
- Subscribe to Message
- Mute Message
- Subscribe to RSS Feed
- Permalink
- Report Inappropriate Content
I see a large collection of Splunkers (70+) are following this question.
Do any of you have any ideas?
My reading on transpose, as well as xyseries and untable (which have been suggested), seem to deal primarily with charting and statistics. My printer is string and time/date. No calculations involved.
Splunk > Clara-fication: transpose, xyseries, untable, and More
Thanks and God bless,
Genesius

