- Find Answers
- :
- Using Splunk
- :
- Dashboards & Visualizations
- :
- Discrepancies between MLTK and Splunk App for Anom...
- Subscribe to RSS Feed
- Mark Topic as New
- Mark Topic as Read
- Float this Topic for Current User
- Bookmark Topic
- Subscribe to Topic
- Mute Topic
- Printer Friendly Page
- Mark as New
- Bookmark Message
- Subscribe to Message
- Mute Message
- Subscribe to RSS Feed
- Permalink
- Report Inappropriate Content
Discrepancies between MLTK and Splunk App for Anomaly Detection
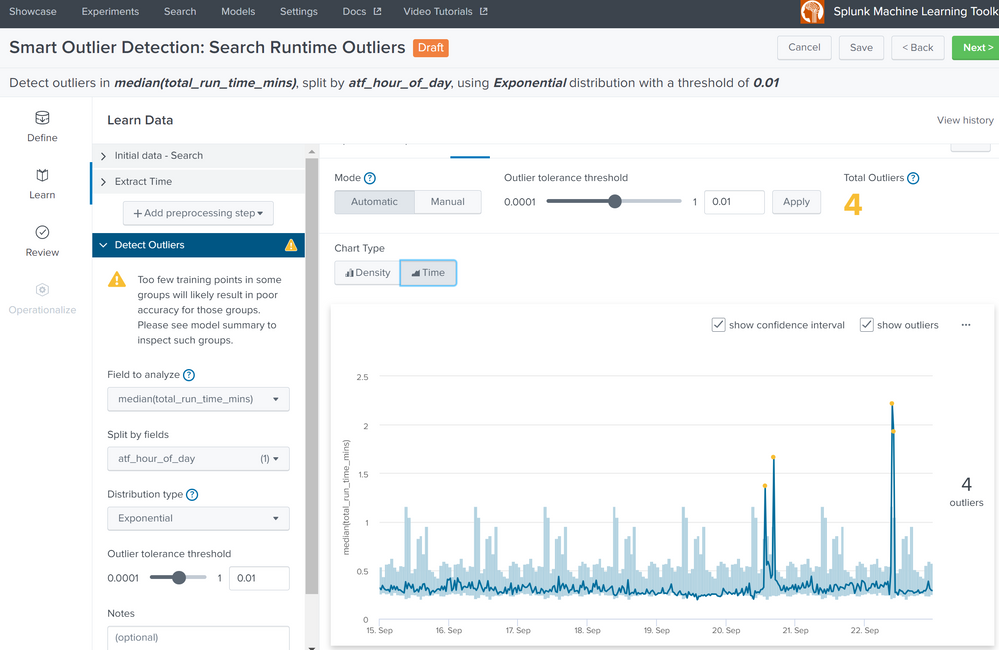
With MLTK, when looking at accumulated runtime, the outliers are detected cleanly (three out of three spikes), whereas with the anomaly detection app, only two of the three spikes are detected (along with one false positive, even at medium sensitivity).
The code generated by the MLTK is as follows -
index=_audit host=XXXXXXXX action=search info=completed
| table _time host total_run_time savedsearch_name
| eval total_run_time_mins=total_run_time/60
| convert ctime(search_*)
| eval savedsearch_name=if(savedsearch_name="","Ad-hoc",savedsearch_name)
| search savedsearch_name!="_ACCEL*" AND savedsearch_name!="Ad-hoc"
| timechart span=30m median(total_run_time_mins)

| eval "atf_hour_of_day"=strftime(_time, "%H"), "atf_day_of_week"=strftime(_time, "%w-%A"), "atf_day_of_month"=strftime(_time, "%e"), "atf_month" = strftime(_time, "%m-%B")
| eventstats dc("atf_hour_of_day"),dc("atf_day_of_week"),dc("atf_day_of_month"),dc("atf_month") | eval "atf_hour_of_day"=if('dc(atf_hour_of_day)'<2, null(), 'atf_hour_of_day'),"atf_day_of_week"=if('dc(atf_day_of_week)'<2, null(), 'atf_day_of_week'),"atf_day_of_month"=if('dc(atf_day_of_month)'<2, null(), 'atf_day_of_month'),"atf_month"=if('dc(atf_month)'<2, null(), 'atf_month') | fields - "dc(atf_hour_of_day)","dc(atf_day_of_week)","dc(atf_day_of_month)","dc(atf_month)" | eval "_atf_hour_of_day_copy"=atf_hour_of_day,"_atf_day_of_week_copy"=atf_day_of_week,"_atf_day_of_month_copy"=atf_day_of_month,"_atf_month_copy"=atf_month | fields - "atf_hour_of_day","atf_day_of_week","atf_day_of_month","atf_month" | rename "_atf_hour_of_day_copy" as "atf_hour_of_day","_atf_day_of_week_copy" as "atf_day_of_week","_atf_day_of_month_copy" as "atf_day_of_month","_atf_month_copy" as "atf_month"

| fit DensityFunction "median(total_run_time_mins)" by "atf_hour_of_day" dist=expon threshold=0.01 show_density=true show_options="feature_variables,split_by,params" into "_exp_draft_ca4283816029483bb0ebe68319e5c3e7"
And the code generated by the anomaly detection app -
``` Same data as above ```

| dedup _time
| sort 0 _time
| table _time XXXX
| interpolatemissingvalues value_field="XXXX"
| fit AutoAnomalyDetection XXXX job_name=test sensitivity=1
| table _time, XXXX, isOutlier, anomConf
The major code difference is that with MLTK, we use -
| fit DensityFunction "median(total_run_time_mins)" by "atf_hour_of_day" dist=expon threshold=0.01 show_density=true show_options="feature_variables,split_by,params" into "_exp_draft_ca4283816029483bb0ebe68319e5c3e7"
whereas with the anomaly detection app, we use -
| fit AutoAnomalyDetection XXXX job_name=test sensitivity=1
| table _time, XXXX, isOutlier, anomConf
Any ideas why the fit function uses DensityFunction vs AutoAnomalyDetection parameters, and why the results are different?
- Mark as New
- Bookmark Message
- Subscribe to Message
- Mute Message
- Subscribe to RSS Feed
- Permalink
- Report Inappropriate Content
DensityFunction and AutoAnomalyDetection are vastly different algorithms, so different results are to be expected. See Developing the Splunk App for Anomaly Detection | Splunk for more info on the Anomaly Detection App's custom algorithm and Algorithms in the Machine Learning Toolkit - Splunk Documentation for the MLTK's DensityFunction.
At least in my testing, the ADESCA/Earthgecko-Skyline stack in the Anomaly Detection App is more prone to alerting on non-cyclical low values when compared to the boundaries generated by the DensityFunction, though I have no good explanation for this behavior as of right now.


