Join the Conversation
- Find Answers
- :
- Using Splunk
- :
- Dashboards & Visualizations
- :
- Re: Dashboard visualization
- Subscribe to RSS Feed
- Mark Topic as New
- Mark Topic as Read
- Float this Topic for Current User
- Bookmark Topic
- Subscribe to Topic
- Mute Topic
- Printer Friendly Page
- Mark as New
- Bookmark Message
- Subscribe to Message
- Mute Message
- Subscribe to RSS Feed
- Permalink
- Report Inappropriate Content
Dashboard visualization
Hi All,
I am trying to create a dashboard panel in trellis view. I have used the below query:
(my search query) | stats count | eval Result=if("count"="0","Ok","Error") | fields - Exception,count
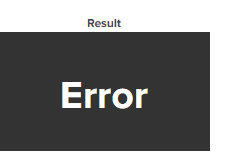
With this I can get the dashboard panel as
Please look into the source below:
<option name="colorBy">value</option>
<option name="colorMode">block</option>
<option name="drilldown">none</option>
<option name="numberPrecision">0</option>
<option name="rangeColors">["0x53a051","0x0877a6","0xf8be34","0xf1813f","0xdc4e41"]</option>
<option name="rangeValues">[0,30,70,100]</option>
<option name="showSparkline">1</option>
<option name="showTrendIndicator">1</option>
<option name="trellis.enabled">1</option>
<option name="trellis.scales.shared">1</option>
<option name="trellis.size">medium</option>
<option name="trendColorInterpretation">standard</option>
<option name="trendDisplayMode">absolute</option>
<option name="unitPosition">after</option>
<option name="useColors">1</option>
<option name="useThousandSeparators">1</option>
</single>
</panel>
Here I have a requirement to change the color of the trellis box. I want it to be green when "Ok" and red when it is "Error".
Please help guide me to achieve the desired output.
Thank you..!!
- Mark as New
- Bookmark Message
- Subscribe to Message
- Mute Message
- Subscribe to RSS Feed
- Permalink
- Report Inappropriate Content
Hi... Can anyone please comment..?
- Mark as New
- Bookmark Message
- Subscribe to Message
- Mute Message
- Subscribe to RSS Feed
- Permalink
- Report Inappropriate Content
@Mrig342
Can you try below solution:
<form>
  <label>test</label>
  <fieldset submitButton="false">
    <input type="time" token="field1">
      <label></label>
      <default>
        <earliest>-15m</earliest>
        <latest>now</latest>
      </default>
    </input>
  </fieldset>
  <row>
    <panel>
      <single>
        <title>Test</title>
        <search>
          <query>index="_internal" | stats count by source  | eval Result=if("count"="0","Ok","Error")| fields Result, count | rangemap field=count low=0-0 default=severe</query>
          <earliest>$field1.earliest$</earliest>
          <latest>$field1.latest$</latest>
        </search>
        <option name="drilldown">none</option>
      </single>
    </panel>
  </row>
</form>
We will be using Splunk's rangemap command, with which we can give colour to required field.
Refer Link to know which colour applies to which severity.
If you find my solution fruitful, then an upvote would be appreciated.

