Join the Conversation
- Find Answers
- :
- Using Splunk
- :
- Dashboards & Visualizations
- :
- Custom Heatmap Overlay in Table
- Subscribe to RSS Feed
- Mark Topic as New
- Mark Topic as Read
- Float this Topic for Current User
- Bookmark Topic
- Subscribe to Topic
- Mute Topic
- Printer Friendly Page
- Mark as New
- Bookmark Message
- Subscribe to Message
- Mute Message
- Subscribe to RSS Feed
- Permalink
- Report Inappropriate Content
Custom Heatmap Overlay in Table
Hi,
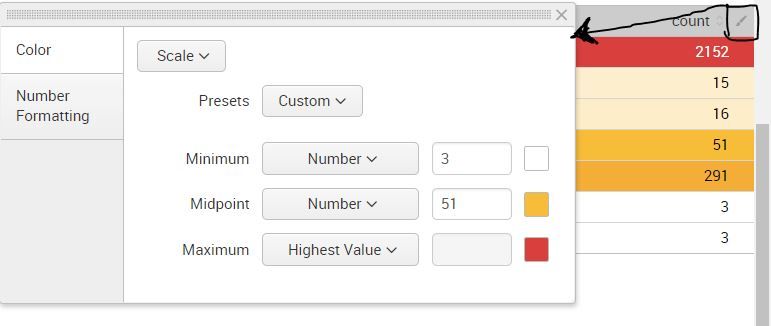
With the current Splunk Enterprise 7.0, I can apply a heatmap to a whole stats table, which is a pretty awesome feature.
Unfortunately, the color range scheme seems to be pretty much 'hardcoded' to a white-to-red shade. I have not found any documentation to customize this. (In the same way it is possible for individual columns).
I there a way to change the color scheme that I have not found (Possibly without tweaking the dashboard CSS/JS, as I am not able to do that)? If not, are there any plans to implement this in the near future?
Thanks,
Jean
- Mark as New
- Bookmark Message
- Subscribe to Message
- Mute Message
- Subscribe to RSS Feed
- Permalink
- Report Inappropriate Content
You can apply a heatmap at the panel level, then alter the colours at the column level as has been suggested by other answers.
Then if you want it to apply to all columns (without any hardcoded names) you simply need to remove the field property from the color palette tag in the source xml. the absence of a field property means apply to all. Of course it may apply to other columns as well (including your key columns... maybe set another one with the key column name specified to override this)
change
<format type="color" field="yourfield">
<colorPalette type="minMidMax" maxColor="#006D9C" minColor="#FFFFFF"></colorPalette>
<scale type="minMidMax"></scale>
</format>
to...
<format type="color">
<colorPalette type="minMidMax" maxColor="#006D9C" minColor="#FFFFFF"></colorPalette>
<scale type="minMidMax"></scale>
</format>
- Mark as New
- Bookmark Message
- Subscribe to Message
- Mute Message
- Subscribe to RSS Feed
- Permalink
- Report Inappropriate Content
Hi, Jean.
If number of columns is constant (for example, it's 4), you can try the following workaround.
Put additional search on your dashboard which returns names of your columns as values in the first row. Something like this:
%your initial search% | transpose | transpose header_field="row 1"
Then assign four tokens in done block:
token="name1" as $result.1$
token="name2" as $result.2$
token="name3" as $result.3$
token="name4" as $result.4$
After this, you will have values of tokens $name_$ are equal to names of your columns.
Then specify format for each column in initial table like this:
format type="color" field="$name1$"
Put corresponding token into field, specify colorPallete as you need.
Maybe you going to have to refresh page by Ctrl + F5.
In example below I assigned column names by random and got this:
PS. I still cannot paste a xml examples in answer form. Formatting looks nice in preview but becomes awful after submit. I tried to use pre and code tags, but all in vain. Could anyone help?
- Mark as New
- Bookmark Message
- Subscribe to Message
- Mute Message
- Subscribe to RSS Feed
- Permalink
- Report Inappropriate Content
- Mark as New
- Bookmark Message
- Subscribe to Message
- Mute Message
- Subscribe to RSS Feed
- Permalink
- Report Inappropriate Content
The columns are created from xyseries and depend on previous search results. Therefore I cannot use this trick here.
- Mark as New
- Bookmark Message
- Subscribe to Message
- Mute Message
- Subscribe to RSS Feed
- Permalink
- Report Inappropriate Content
Not understood why you wont be able to that...
I just tried for simple xyseries query to customize color and its working
index=_internal | stats count by sourcetype source component | eval temp=source."#".component| xyseries temp sourcetype count
- Mark as New
- Bookmark Message
- Subscribe to Message
- Mute Message
- Subscribe to RSS Feed
- Permalink
- Report Inappropriate Content
It will work as long as the columns stay the same, which is not true in my use case.
- Mark as New
- Bookmark Message
- Subscribe to Message
- Mute Message
- Subscribe to RSS Feed
- Permalink
- Report Inappropriate Content
could you please provide your sample query
- Mark as New
- Bookmark Message
- Subscribe to Message
- Mute Message
- Subscribe to RSS Feed
- Permalink
- Report Inappropriate Content
The query is not very interesting, all I can say is that it will return very different columns at different time of the day/periods. Specifically, I cannot predict the value of those. At one time, I may get columns C1, C2, C3, C4, and another time C6, C7, C8, C9. The following day, I may have entirely new columns altogether. This is why I apply the overlay to the whole table vs. individual columns.


