Turn on suggestions
Auto-suggest helps you quickly narrow down your search results by suggesting possible matches as you type.
Dashboards & Visualizations
×
Join the Conversation
Without signing in, you're just watching from the sidelines. Sign in or Register to connect, share, and be part of the Splunk Community.
Turn on suggestions
Auto-suggest helps you quickly narrow down your search results by suggesting possible matches as you type.
- Find Answers
- :
- Using Splunk
- :
- Dashboards & Visualizations
- :
- Creating colored tiles based on status field
Options
- Subscribe to RSS Feed
- Mark Topic as New
- Mark Topic as Read
- Float this Topic for Current User
- Bookmark Topic
- Subscribe to Topic
- Mute Topic
- Printer Friendly Page
- Mark as New
- Bookmark Message
- Subscribe to Message
- Mute Message
- Subscribe to RSS Feed
- Permalink
- Report Inappropriate Content
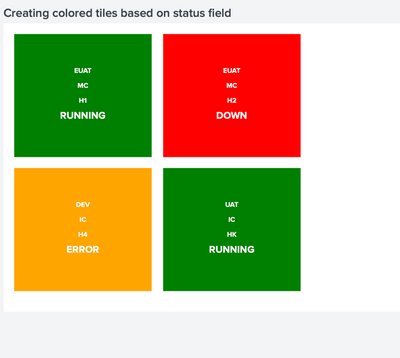
Creating colored tiles based on status field
shakSplunk
Path Finder
08-17-2021
06:26 AM
Hi all,
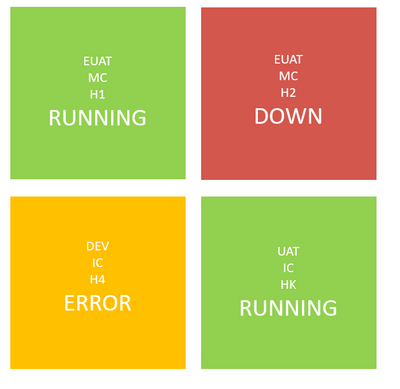
I was wondering, with the following table would I be able to create a set of tiles that would be color coded based on the status field and also visualise also show the application in large font:
| Environment | Application | Hostname | Status |
| EUAT | MC | H1 | RUNNING |
| EUAT | MC | H2 | DOWN |
| DEV | IC | H4 | ERROR |
| UAT | IC | HK | RUNNING |
I was hoping that "RUNNING" would be green, "DOWN" be red and "ERROR" be orange.
Any assistance would be greatly appreciated!
- Mark as New
- Bookmark Message
- Subscribe to Message
- Mute Message
- Subscribe to RSS Feed
- Permalink
- Report Inappropriate Content
kamlesh_vaghela

SplunkTrust
08-17-2021
10:17 AM
Can you please try this?
<dashboard script="a.js">
<label>Creating colored tiles based on status field</label>
      <search id="my_search">
          <query>| makeresults
| eval _raw="Environment,Application,Hostname,Status
EUAT,MC,H1,RUNNING
EUAT,MC,H2,DOWN
DEV,IC,H4,ERROR
UAT,IC,HK,RUNNING"
| multikv forceheader=1
| table Environment Application Hostname Status
| eval Color=case(Status="RUNNING","GREEN",Status="DOWN","RED",Status="ERROR","ORANGE")</query>
        <earliest>-24h@h</earliest>
        <latest>now</latest>
      </search>
<row>
  <panel>
    <html>
      <div style="width:50%" id="root"></div>
    </html>
    <html>
      <style>
        #root .square {
              float:left;
              position: relative;
              width: 40%;
              padding-bottom : 30%; /* = width for a 1:1 aspect ratio */
              margin:1.66%;
              overflow:hidden;
          }

          #root .content {
              text-align: center;
              position:absolute;
              color:white;
              height:90%; /* = 100% - 2*5% padding */
              width:90%; /* = 100% - 2*5% padding */
              padding: 5%;
          }

          #root h3, #root h1 {
            color: white;
          }
      </style>
    </html>
  </panel>
</row>
</dashboard>
a.js
require([
'underscore',
'jquery',
'splunkjs/mvc',
'splunkjs/mvc/simplexml/ready!'
], function(_, $, mvc) {
var mySearch = mvc.Components.get("my_search");
mySearch.on('search:done', function(properties) {
var myResults = mySearch.data("results");
myResults.on("data", function() {
resultArray = myResults.data().rows;
var templateRawText = `
<div class="square" style="background-color: <%= val5 %>;">
<div> </div>
<div> </div>
<div class="content numbers">
<h3><%= val1 %></h3>
<h3><%= val2 %></h3>
<h3><%= val3 %></h3>
<h1><%= val4 %></h1>
</div>
</div>`;
var compiledTemplate = _.template(templateRawText);
$.each(resultArray, function(index, value) {
console.log(value);
var templateResult = compiledTemplate({
val1: value[0],
val2: value[1],
val3: value[2],
val4: value[3],
val5: value[4],
});
$("#root").append(templateResult);
});
})
})
});
KV
- Mark as New
- Bookmark Message
- Subscribe to Message
- Mute Message
- Subscribe to RSS Feed
- Permalink
- Report Inappropriate Content
ITWhisperer

SplunkTrust
08-17-2021
07:38 AM
  <row>
    <panel depends="$stayhidden$">
      <html>
        <style>
          #tiles table tbody tr{
            margin-right:10px;
            margin-bottom:10px;
          }
          #tiles table tbody tr td{
            width: 180px;
            text-align: center;
          }
          #tiles table tbody tr td[data-cell-index="1"]{
            font-size: 2em;
          }
          #tiles table tbody td div.multivalue-subcell[data-mv-index="1"]{
            display: none;
          }
        </style>
      </html>
    </panel>
    <panel id="tiles">
      <table>
        <search>
          <query>| makeresults
| eval _raw="Environment,Application,Hostname,Status
EUAT,MC,H1,RUNNING
EUAT,MC,H2,DOWN
DEV,IC,H4,ERROR
UAT,IC,HK,RUNNING"
| multikv forceheader=1
| table Environment Application Hostname Status
| eval Application=mvappend(Application,case(Status="RUNNING","GREEN",Status="DOWN","RED",Status="ERROR","ORANGE"))</query>
          <earliest>-24h@h</earliest>
          <latest>now</latest>
        </search>
        <option name="drilldown">none</option>
        <option name="refresh.display">progressbar</option>
        <format type="color">
          <colorPalette type="expression">case (match(value,"RED"), "#ff0000",match(value,"ORANGE"), "#ff8000",match(value,"GREEN"),"#00ff00",true(),"#ffffff")</colorPalette>
        </format>
      </table>
    </panel>
  </row>
- Mark as New
- Bookmark Message
- Subscribe to Message
- Mute Message
- Subscribe to RSS Feed
- Permalink
- Report Inappropriate Content
shakSplunk
Path Finder
08-17-2021
08:52 AM
Get Updates on the Splunk Community!
[Puzzles] Solve, Learn, Repeat: Dynamic formatting from XML events
This challenge was first posted on Slack #puzzles channelFor a previous puzzle, I needed a set of fixed-length ...
Enter the Agentic Era with Splunk AI Assistant for SPL 1.4
🚀 Your data just got a serious AI upgrade — are you ready?
Say hello to the Agentic Era with the ...
Stronger Security with Federated Search for S3, GCP SQL & Australian Threat ...
Splunk Lantern is a Splunk customer success center that provides advice from Splunk experts on valuable data ...


