- Find Answers
- :
- Using Splunk
- :
- Dashboards & Visualizations
- :
- Checkbox to select specific apps and to show their...
- Subscribe to RSS Feed
- Mark Topic as New
- Mark Topic as Read
- Float this Topic for Current User
- Bookmark Topic
- Subscribe to Topic
- Mute Topic
- Printer Friendly Page
- Mark as New
- Bookmark Message
- Subscribe to Message
- Mute Message
- Subscribe to RSS Feed
- Permalink
- Report Inappropriate Content
Hi,
I have already made a dashboard where a panel shows index usage in GB per index. I have to edit it in this way. Say, one application websphere has 3 indexes. I want to see all three of them at the same time if I select websphere, a checkbox according to applications. Say if I select websphere application, it shows me 3 indexes and their use.
- Mark as New
- Bookmark Message
- Subscribe to Message
- Mute Message
- Subscribe to RSS Feed
- Permalink
- Report Inappropriate Content
You can use SPLUNK REST command to pull App names and corresponding indexes (provided you have access to execute REST calls).
| rest /services/data/indexes
| dedup eai:acl.app
| table eai:acl.app, title
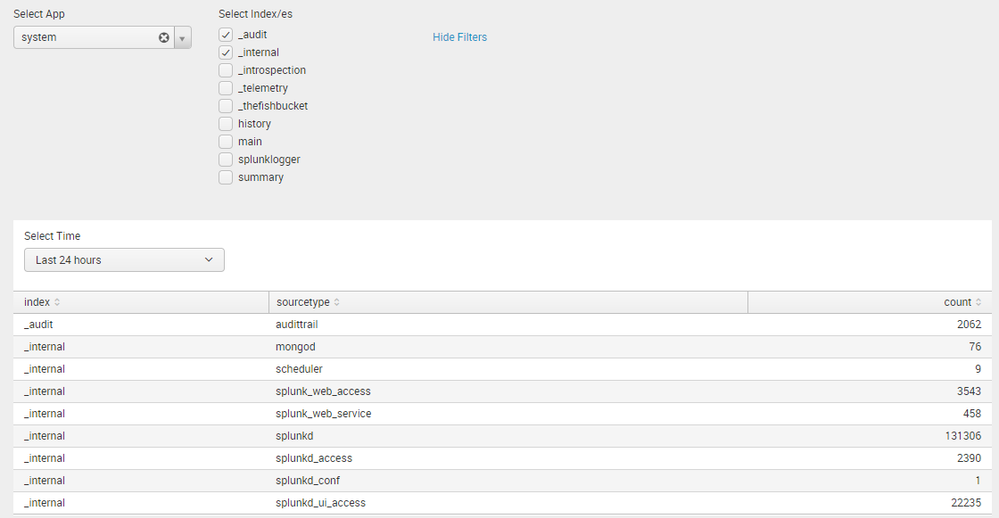
Following is an example which uses REST API call to populate App names in Dropdown and based on selection of App populated all App's Indexes as check boxes. Based on check boxes which are selected it gets the stats from selected index/es using tstats generating command.
PS: By default selected app is system and selected indexes are _audit and _internal. Search Panel is hidden based on depends attribute ontokIndex and time picker is added to stats panel as well.
<form>
  <label>REST app based indexes</label>
  <fieldset submitButton="false">
    <input type="dropdown" token="tokApp" searchWhenChanged="true">
      <label>Select App</label>
      <fieldForLabel>eai:acl.app</fieldForLabel>
      <fieldForValue>eai:acl.app</fieldForValue>
      <search>
        <query>| rest /services/data/indexes
| dedup eai:acl.app
| table eai:acl.app</query>
        <earliest>-24h@h</earliest>
        <latest>now</latest>
      </search>
      <default>system</default>
    </input>
    <input type="checkbox" token="tokIndex" searchWhenChanged="true">
      <label>Select Index/es</label>
      <fieldForLabel>title</fieldForLabel>
      <fieldForValue>title</fieldForValue>
      <search>
        <query>| rest /services/data/indexes
| search eai:acl.app="$tokApp$"
| table title</query>
        <earliest>-24h@h</earliest>
        <latest>now</latest>
      </search>
      <delimiter> OR  </delimiter>
      <valuePrefix>index="</valuePrefix>
      <valueSuffix>"</valueSuffix>
      <default>_audit,_internal</default>
    </input>
  </fieldset>
  <row>
    <panel>
      <input type="time" token="tokTime" searchWhenChanged="true">
        <label>Select Time</label>
        <default>
          <earliest>-24h@h</earliest>
          <latest>now</latest>
        </default>
      </input>
      <table depends="$tokIndex$">
        <search>
          <query>| tstats prestats=t count where $tokIndex$ by sourcetype</query>
          <earliest>$tokTime.earliest$</earliest>
          <latest>$tokTime.latest$</latest>
        </search>
        <option name="drilldown">none</option>
      </table>
    </panel>
  </row>
</form>
PS: Refer to Splunk 6.x Dashboard Examples App from Splunkbase for more such examples on handling Splunk input values using Dynamic search options.
| makeresults | eval message= "Happy Splunking!!!"
- Mark as New
- Bookmark Message
- Subscribe to Message
- Mute Message
- Subscribe to RSS Feed
- Permalink
- Report Inappropriate Content
I am adding this search to the search string.. Why I am not getting any result?
|eventcount summarize=false report_size=true index=* index=_*|search index=$tokIndex$|stats sum(size_bytes) As size_bytes by index|Eval size_bytes_GB=size_bytes/1024/1024/1024|table index size_bytes_GB|sort - size_bytes_GB
- Mark as New
- Bookmark Message
- Subscribe to Message
- Mute Message
- Subscribe to RSS Feed
- Permalink
- Report Inappropriate Content
Error here is error in search command unable to parse the search comparator = has an invalid term on the lhs
- Mark as New
- Bookmark Message
- Subscribe to Message
- Mute Message
- Subscribe to RSS Feed
- Permalink
- Report Inappropriate Content
you might have to paste your code using Code button (101010) so that special characters do not escape.
| makeresults | eval message= "Happy Splunking!!!"
- Mark as New
- Bookmark Message
- Subscribe to Message
- Mute Message
- Subscribe to RSS Feed
- Permalink
- Report Inappropriate Content
Thankyou so much Niket. But I get an issue. Data populates for system app. But if I select any other app, it says an error :error in tsidxStats:where clause is not an exact query. Also select index checkbox is disabled
- Mark as New
- Bookmark Message
- Subscribe to Message
- Mute Message
- Subscribe to RSS Feed
- Permalink
- Report Inappropriate Content
Oh wow.. I just copy pasted ur code and it worked.. Thanks buddy
- Mark as New
- Bookmark Message
- Subscribe to Message
- Mute Message
- Subscribe to RSS Feed
- Permalink
- Report Inappropriate Content
Anytime 🙂
| makeresults | eval message= "Happy Splunking!!!"

