Are you a member of the Splunk Community?
- Find Answers
- :
- Using Splunk
- :
- Dashboards & Visualizations
- :
- Can I set an alert that turns my dashboard red whe...
- Subscribe to RSS Feed
- Mark Topic as New
- Mark Topic as Read
- Float this Topic for Current User
- Bookmark Topic
- Subscribe to Topic
- Mute Topic
- Printer Friendly Page
- Mark as New
- Bookmark Message
- Subscribe to Message
- Mute Message
- Subscribe to RSS Feed
- Permalink
- Report Inappropriate Content
Can I set an alert that turns my dashboard red when triggered?
Would like to trigger an alert and show the dashboard status as RED when the duration > 0.0205035.
Below are the steps I am creating
1. Creating a Single view dashboard for the Service of Full GC count
2. Based on the duration condition above specified the single value dashboard has to show as RED
3. from single value dashboard ..navigating to the Trend chart
Sample data:
28820.220: [Full GC (System.gc()) 8832K->8624K(37888K), 0.0261704 secs]
29372.500: [GC (Allocation Failure) 23984K->8816K(37888K), 0.0013546 secs]
29932.500: [GC (Allocation Failure) 24176K->8808K(37888K), 0.0017082 secs]
30492.500: [GC (Allocation Failure) 24168K->8960K(37888K), 0.0017122 secs]
31047.500: [GC (Allocation Failure) 24320K->8944K(37888K), 0.0020634 secs]
31602.500: [GC (Allocation Failure) 24304K->8992K(37888K), 0.0017542 secs]
32157.500: [GC (Allocation Failure) 24352K->8968K(37888K), 0.0018971 secs]
32420.247: [Full GC (System.gc()) 16160K->8944K(37888K), 0.0012816 secs]
32420.248: [Full GC (System.gc()) 8944K->8624K(37888K), 0.0205035 secs]"
- Mark as New
- Bookmark Message
- Subscribe to Message
- Mute Message
- Subscribe to RSS Feed
- Permalink
- Report Inappropriate Content
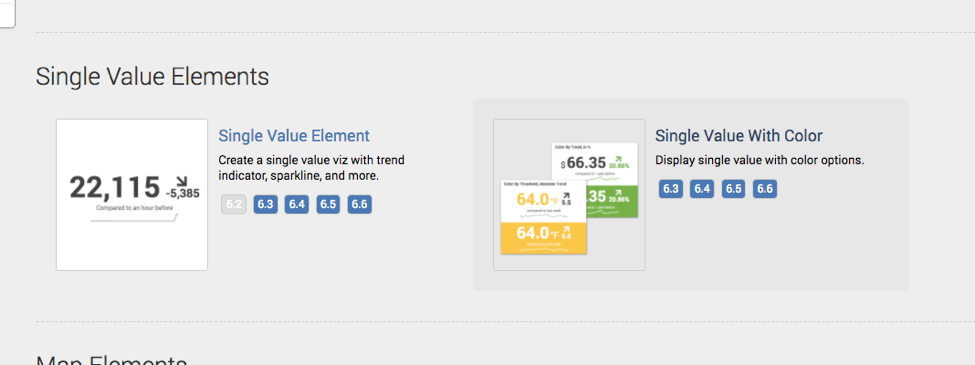
Take a look at the Splunk Dashboard Examples app. There is an example there of using single value metrics with color. You will see multiple examples as well as the XML behind the scenes that will allow you to see the parameters required for each example.

