Join the Conversation
- Find Answers
- :
- Using Splunk
- :
- Dashboards & Visualizations
- :
- 2 ways to write a line chart in XML - the differen...
- Subscribe to RSS Feed
- Mark Topic as New
- Mark Topic as Read
- Float this Topic for Current User
- Bookmark Topic
- Subscribe to Topic
- Mute Topic
- Printer Friendly Page
- Mark as New
- Bookmark Message
- Subscribe to Message
- Mute Message
- Subscribe to RSS Feed
- Permalink
- Report Inappropriate Content
2 ways to write a line chart in XML - the difference.
What is the difference in Panel1 and Panel2 below?
The searches are the same and both panels produce the same line chart, but I can't seem to tell the difference.
Is just another way of writing the same thing?
Is 1 panel better than the other, and if so why?
They were just created by adding a panel to a dashboard, but I am not sure how I created them to make them look so different in the XML Code.
Can anyone advise?
Panel1:
  <row>
    <panel>
      <title>Title Panel1</title>
      <chart>
        <search>
          <query>index= .... </query>
          <earliest>-24h@h</earliest>
          <latest>now</latest>
          <sampleRatio>1</sampleRatio>
        </search>
        <option name="charting.axisLabelsX.majorLabelStyle.overflowMode">ellipsisNone</option>
        <option name="charting.axisLabelsX.majorLabelStyle.rotation">0</option>
        <option name="charting.axisTitleX.visibility">visible</option>
        <option name="charting.axisTitleY.visibility">visible</option>
        <option name="charting.axisTitleY2.visibility">visible</option>
        <option name="charting.axisX.scale">linear</option>
        <option name="charting.axisY.scale">linear</option>
        <option name="charting.axisY2.enabled">0</option>
        <option name="charting.axisY2.scale">inherit</option>
        <option name="charting.chart">line</option>
        <option name="charting.chart.bubbleMaximumSize">50</option>
        <option name="charting.chart.bubbleMinimumSize">10</option>
        <option name="charting.chart.bubbleSizeBy">area</option>
        <option name="charting.chart.nullValueMode">gaps</option>
        <option name="charting.chart.showDataLabels">none</option>
        <option name="charting.chart.sliceCollapsingThreshold">0.01</option>
        <option name="charting.chart.stackMode">default</option>
        <option name="charting.chart.style">minimal</option>
        <option name="charting.drilldown">all</option>
        <option name="charting.layout.splitSeries">0</option>
        <option name="charting.layout.splitSeries.allowIndependentYRanges">0</option>
        <option name="charting.legend.labelStyle.overflowMode">ellipsisMiddle</option>
        <option name="charting.legend.placement">right</option>
      </chart>
    </panel>
  </row>
Panel2:
         <row>
        <panel>
          <title>
Title Panel2
          </title>
          <chart>
            <search>
              <query>
    index=... <same as search in panel 1 above>
                </query>
              <earliest>-24h@h</earliest>
              <latest>now</latest>
              <sampleRatio>1</sampleRatio>
            </search>
            <option name="charting.chart">line</option>
          </chart>
        </panel>
      </row>
- Mark as New
- Bookmark Message
- Subscribe to Message
- Mute Message
- Subscribe to RSS Feed
- Permalink
- Report Inappropriate Content
i created a test dashboard and added two panels, with search query
index=_internal | timechart count
i saved the dashboard and opened again.
i clicked the "Edit Source", both panels XML Source looks same.
i clicked the "done" and came out.
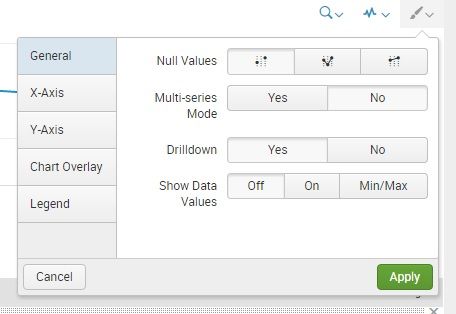
again, i clicked edit panel, i selected "Show data values Min/Max", applied the changes.
when i check the "Edit Source" again, i will see the two xml's you have given here exactly.
So, you have added two panels and edited one panel properties. that added some more xml lines.
Sekar
PS - If this or any post helped you in any way, pls consider upvoting, thanks for reading !
- Mark as New
- Bookmark Message
- Subscribe to Message
- Mute Message
- Subscribe to RSS Feed
- Permalink
- Report Inappropriate Content
@HattrickNZ, default value for Chart Configuration is used when the same is not explicitly passed from UI. Refer to default values for various chart configurations: https://docs.splunk.com/Documentation/Splunk/latest/Viz/ChartConfigurationReference
Unless you need to override any of the settings you can get rid of the same and default values should still be used.
| makeresults | eval message= "Happy Splunking!!!"

